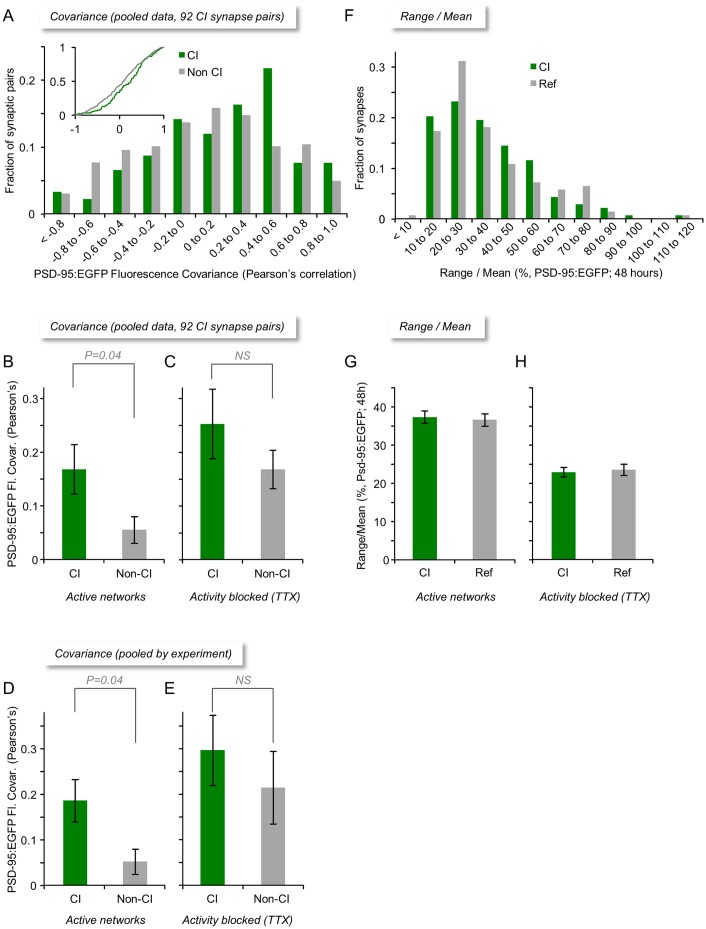
Fig 3. Size remodeling covariance of CI and non-CI synapses in monolithic networks.
(A) Distributions of size remodeling covariance values (Pearson’s correlation) for CI and non-CI synapse pairs (92 CI pairs from 24 neurons in 6 experiments). Inset: Same data shown as cumulative histogram. (B,C) Average (±SEM) size remodeling covariance for all CI and non-CI synapse pairs in spontaneously active networks (B) and after suppressing spontaneous activity with TTX (C). (D, E) Same as (B, C)—data pooled by experiment. (F) Distributions of range over mean values for CI and Ref synapses for the same two-day imaging periods. (G, H) Average (±SEM) of range over mean values for all CI and Ref synapses in spontaneously active networks (E) and after suppressing spontaneous activity with TTX (F). Statistical significance values based on two-tailed Mann-Whitney U tests. Source data provided in S1 Data.

