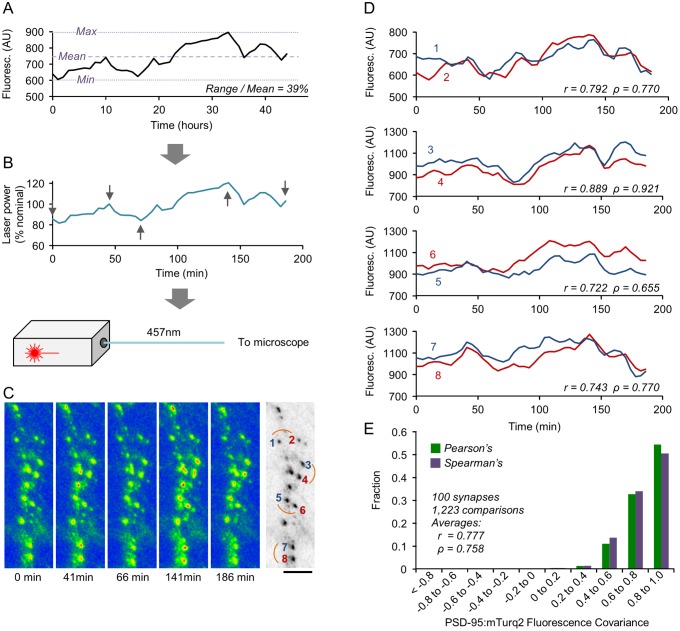
Fig 7. Measuring maximal detectable covariance values.
(A) A synapse selected to serve as a template for excitation light intensity modulation, based on a range over mean value similar to the average range over mean values measured over 48-h periods for PSD-95:EGFP and PSD-95:mTurq2 puncta belonging to CI synapses; (~37%; Fig 3G and ~35%, not shown, respectively). (B) The intensity of the excitation laser was modulated to match changes in the fluorescence of selected synapses such as that shown in (A). Intensity was modulated around nominal laser intensities (expressed here as 100%). (C) Pseudocolor images of a segment of a dendrite expressing PSD-95:mTurq2 at five time points (gray arrows in B). The image on the right is an inverted grayscale of the first image (t = 0). Bar, 10 μm. (D) Comparisons of fluorescence covariance for pairs of PSD-95:mTurq2 puncta connected by short arcs in (C) (right-hand side). Note the marked but imperfect fluorescence covariance for such pairs. (E) Distribution of covariance values (Pearson’s and Spearman’s correlations) for 1,223 comparisons made for 100 synapses from 4 different neurons. Source data for (E) provided in S1 Data.

