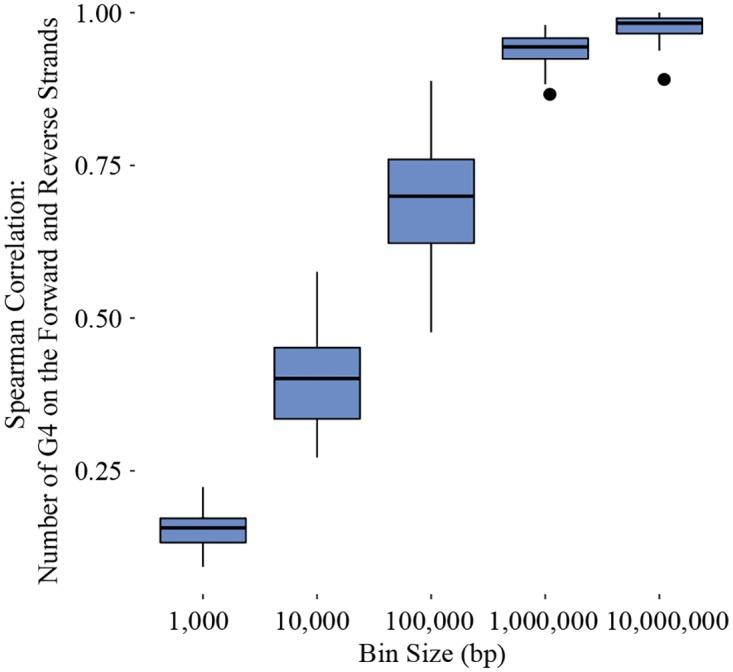
Fig 4. Boxplots representing the range of correlation between the number of G4 sequences on the forward and reverse strands for all chromosomes at different bin sizes.

The boxes represent the 25th to 75th percentile, and the end of each line is either the end of the data range or 1.5 of the interquartile range. Dots extending beyond the lines are correlations considered outliers.
