
Fig. 1. Domain architecture of VAR2CSA.
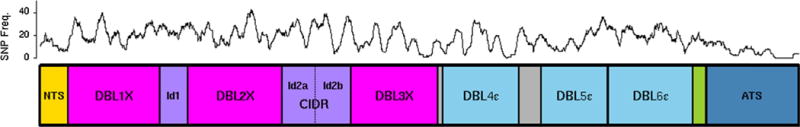
Schematic organization of VAR2CSA protein, showing its N-terminal sequence, 6 cysteine-rich Duffy binding like (DBL) domains, inter-domain (ID) regions, and intracytoplasmic tail (acidic terminal sequence, ATS). Prevalence of sequence variability along the extent of the protein is graphically displayed as the number of single nucleotide polymorphisms (SNPs) per 100 nucleotides, measured as a moving average along the sequence. Analysis does not include insertion/deletion differences. SNP data obtained from PlasmoDB. Figure and sequence analysis prepared by Robert Morrison.