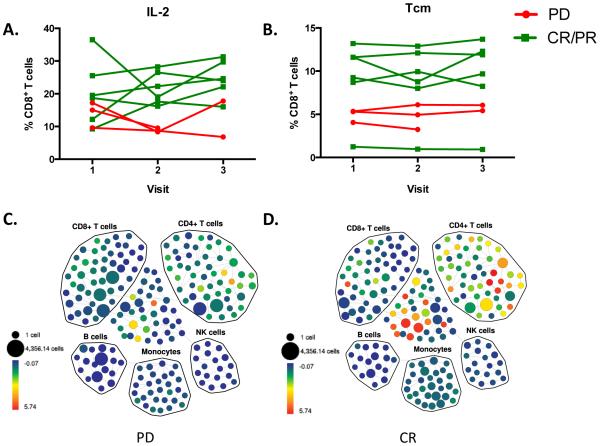
Figure 4.
Intracellular cytokine staining and mass cytometric analyses of ex vivo stimulated PBMC from melanoma patients treated with radiation and ipilimumab (A) PBMC from melanoma patients receiving ipilimumab were collected and cryopreserved at baseline pre-treatment (visit 1), 2nd ipilimumab dose (visit 2) and 4th ipilimumab dose (visit 3). PBMC samples were rested and stimulated with PMA and Ionomycin for 4 hours, and then stained with the antibody panel shown in Table 1, and analyzed by CyTOF. IL-2 expression in CD8+ T cells is shown in A. PD and CR/PR groups were significantly different (p<0.01) (B) Mass cytometric analysis of samples from A revealed differences in CCR7+CD45RA− CD8+ T cells (central memory, Tcm). PD and CR/PR groups were found to be significantly different (p<0.05) (C-D) SPADE analysis of baseline IL-2 CyTOF data from one representative patient each for progressive disease and complete response. PD=Progressive Disease, CR/PR=Complete Response/Partial Response. *p<0.05.

