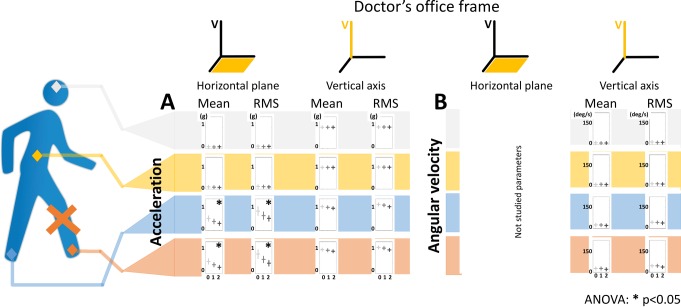
Fig 2. Selected 24 parameters out of the 60 IMU based parameters computed in the doctor’s office linked frame obtained from 4 IMUs on 12 control subjects and 48 patients during a 10 meters go and 10 meters back walking task.
Sensor location are shown on the walking silhouette by colored diamonds: grey for the head, yellow for the sacrum, blue for the contralateral foot and red for the ipsilateral foot. The red cross of the walking silhouette indicates the ipsilateral foot to the lesion defined by the side where the patient is the more symptomatic. Each parameter is represented by a bar diagram. The row indicate the location of the sensor and whether the parameters is computed on an acceleration (A) or an angular velocity signal (B). The columns indicate whether the parameter is computed on the horizontal plane or on the vertical axis and whether the parameter is a mean or a RMS of the norm of the walking signal. In each bar diagram, the parameter is represented as a function of the severity. The results are shown by a modulated grey cross: horizontal bar stands for mean and vertical bar stands for the standard deviation. Light grey represents the healthy group (G0), medium grey the moderately impaired group (G1) and dark grey the severely impaired group (G2). The parameters marked by a star (*) are the discriminating parameters (parameters that show significant difference between the three WOMAC index defined severity groups). The statistical analysis was performed with an ANOVA analysis and a Tukey pairwise comparison test (p-value set at 0.05). RMS stands for root mean square and V for vertical axis.

