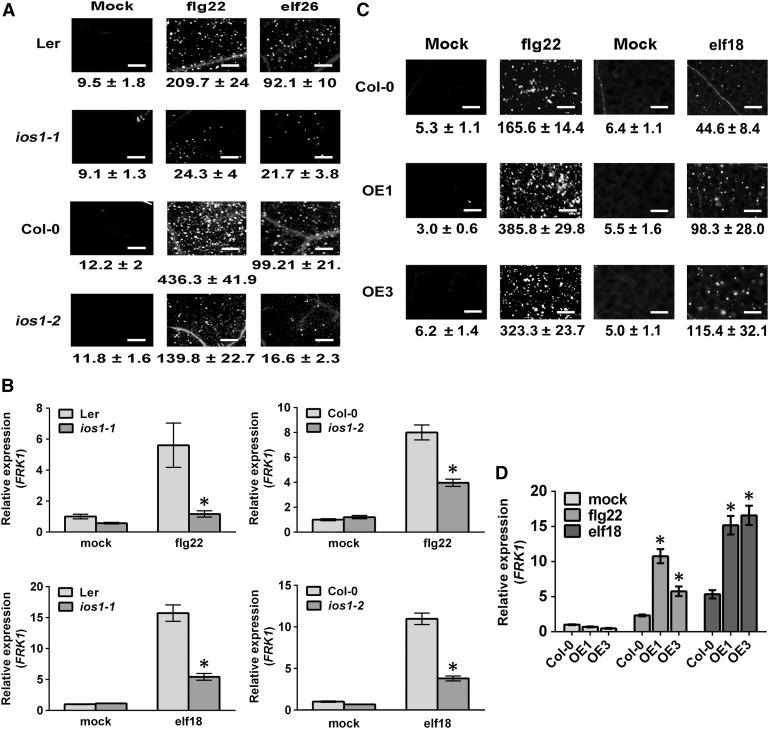
Figure 2.
Altered Late PTI Responses in ios1 Mutants and IOS1-OE Lines.
(A) and (C) Callose deposition. Leaves of 5-week-old ios1-1 and ios1-2 (A) were syringe infiltrated with 1 µM flg22 or elf26 and samples were collected 9 h (flg22) or 24 h (elf26) later for aniline blue staining. For IOS1-OE lines (C), leaves of 5-week-old Arabidopsis or 10-d-old seedlings were respectively syringe infiltrated with 1 µM flg22 or treated with 100 nM elf18 and samples were collected 6 h (flg22) or 16 h (elf18) later for aniline blue staining. Mock samples were infiltrated with MgSO4 (for flg22 and elf26) or water (for elf18). Numbers under the pictures are average ± sd of the number of callose deposits per square millimeter from at least two independent experiments each consisting of 6 plants (n = 12). Bar = 200 µm.
(B) and (D) PTI-responsive gene FRK1 upregulation. Relative FRK1 expression levels were evaluated at 30 min posttreatment with 100 nM flg22 or elf18 in ios1-1 and ios1-2 mutants (B) or at 45 min posttreatment with 50 nM flg22 or elf18 in IOS1-OE lines (D). UBQ10 was used for normalization. Relative gene expression levels were compared with wild-type mock (Ler-0 or Col-0) (defined value of 1) by RT-qPCR analyses. The values are means ± sd of two independent experiments each with three batches of 20 plantlets (n = 6). Asterisks indicate a significant difference to wild-type controls based on a paired two-tailed t test (P < 0.01).

