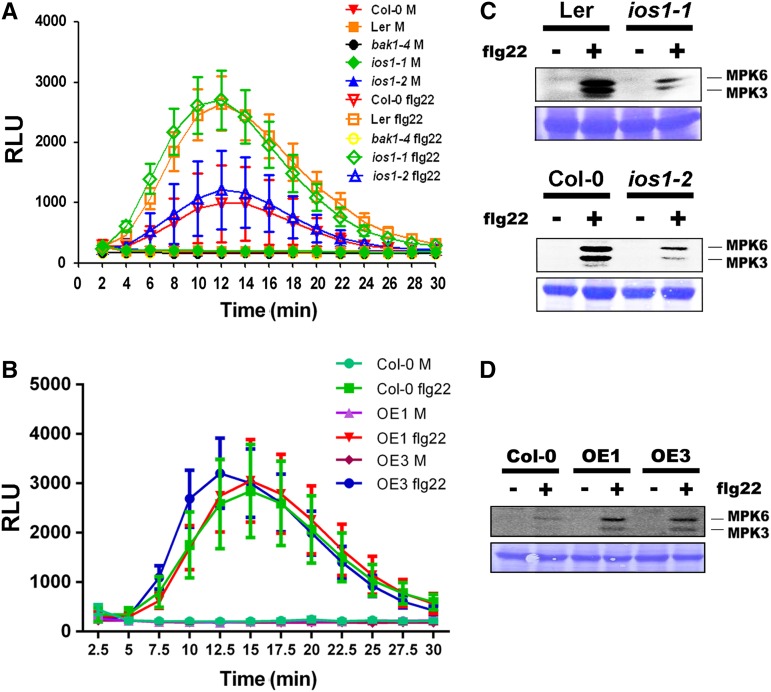
Figure 3.
Early PTI Responses.
(A) ROS production in ios1 mutants. Responsiveness of 5-week-old Ler-0 and Col-0 wild-type controls and respective mutants ios1-1 and ios1-2 to 10 nM flg22. bak1-4 was used as a negative control. Production of ROS in Arabidopsis leaf discs is expressed as relative light units (RLU) for a period of 30 min after elicitation. Values are means ± se of three independent experiments each with six leaf discs (n = 18). Differences between ios1 mutants and the wild type were not statistically significant based on a paired two-tailed t test (P < 0.01).
(B) ROS production in IOS1-OE lines. Responsiveness of 5-week-old overexpression lines OE1 and OE3 and Col-0 wild-type control to 10 nM flg22. Production of ROS in Arabidopsis leaf discs is expressed as relative light units for a period of 30 min after elicitation. Values are means ± se of three independent experiments each with six leaf discs (n = 18). Differences between OE lines and the wild type were not statistically significant based on a paired two-tailed t test (P < 0.01).
(C) MPK activation in ios1 mutants. Ten-day-old Ler-0 and ios1-1 or Col-0 and ios1-2 were treated with 100 nM flg22 for 5 min. Immunoblot analysis using phospho-p44/42 MPK antibody is shown in top panel. Lines indicate the positions of MPK3 and MPK6. Coomassie blue staining is used to estimate equal loading in each lane (bottom panel). Similar results were observed in another independent repeat.
(D) MAPK activation in IOS1-OE lines. Ten-day-old Col-0 and IOS1 overexpression lines OE1 and OE3 were treated with 50 nM flg22 for 5 min. Immunoblot analysis using phospho-p44/42 MAP kinase antibody is shown in the top panel. Lines indicate the positions of MPK3 and MPK6. Coomassie blue staining is used to estimate equal loading in each lane (bottom panel). Similar results were observed in another independent repeat.

