Figure 7.
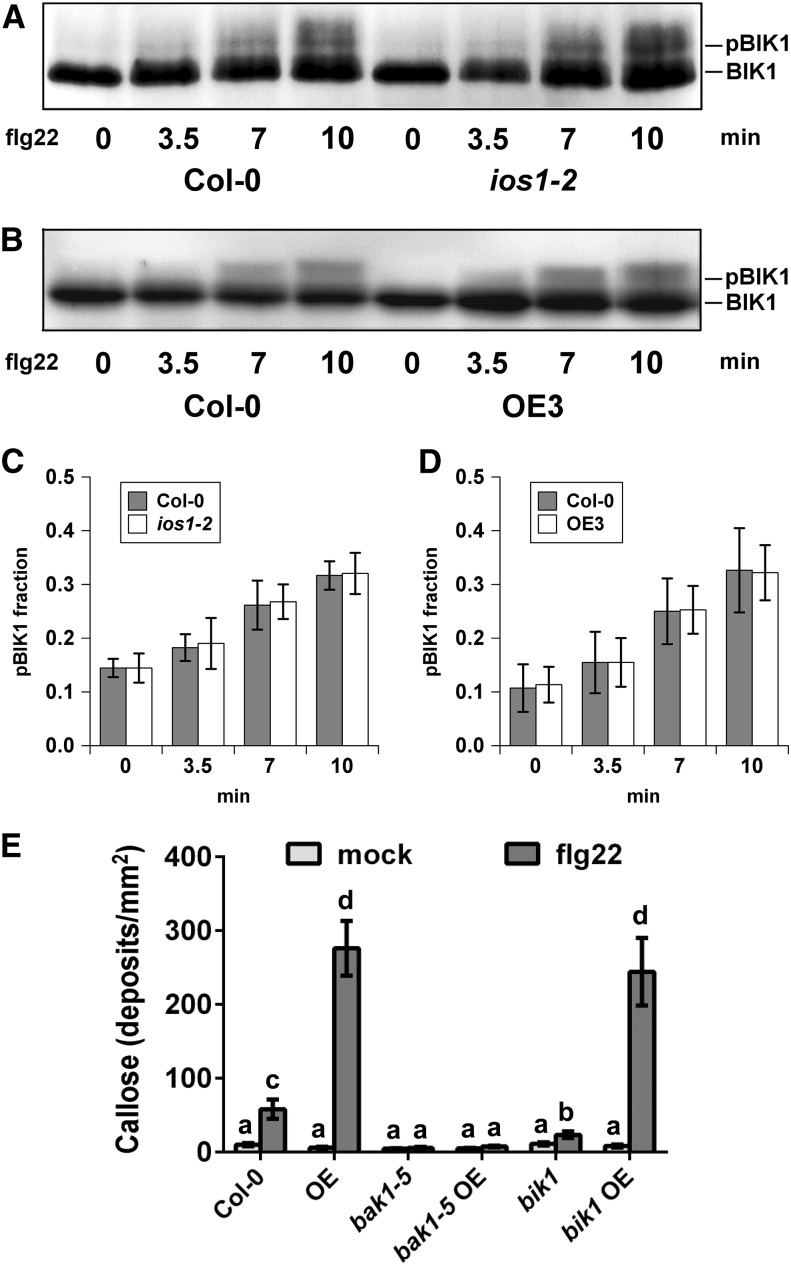
IOS1 Functions in a BAK1-Dependent but BIK1-Independent Manner in the FLS2 Complex.
(A) to (D) Immunoblot analysis of BIK1 phosphorylation revealed by gel mobility shift. Nonphosphorylated (BIK1) and phosphorylated (pBIK1) BIK1 signals are indicated. Protoplasts from Col-0 leaves and ios1-2 ([A] and [C]) or OE3 ([B] and [D]) were treated 4 h after transfection using 0.75 µM flg22 for 3.5, 7, and 10 min. The reaction was stopped by immersion in liquid nitrogen following concentration by low speed centrifugation. Experiments were repeated at least five times with similar results. For (C) and (D), phosphorylated over nonphosphorylated BIK1 fractions were calculated by measuring digital signals with the ImageJ software. Values are means ± sd of five independent biological replicates (n = 5). For each time point, differences between the wild type and the ios1-2 mutant or the OE3 line were not statistically significant based on a paired two-tailed t test (P < 0.01).
(E) Callose deposition upon elicitation with flg22. Fourteen-day-old Col-0 wild-type, IOS1-OE3 (OE), bak1-5 or bik1 mutants, and IOS1-OE in bak1-5 or bik1 mutant background were treated with 100 nM flg22 and samples were collected 16 h later for aniline blue staining. Each bar represents average ± se of callose deposits per square millimeter from two independent experiments each with six plants (n = 12). For IOS1-OE lines in the bak1-5 and bik1 backgrounds, data represent two independent transformation events for each genotype. Different letters denote significant differences among different lines based on a one-way ANOVA with post-hoc Tukey HSD (P < 0.01).

