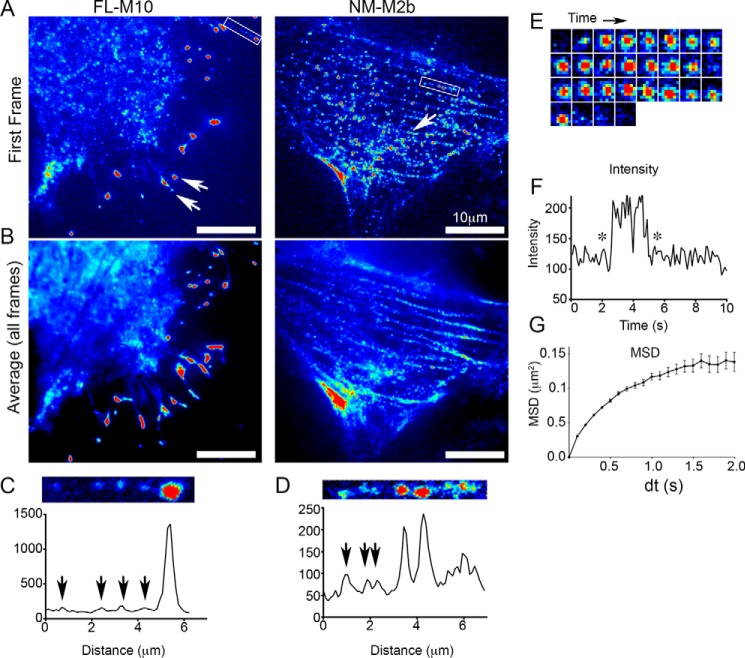
FIGURE 2.
TIRF images of FL-M10 and NM-M2b and analysis of intensities and FL-M10 spot mobilities. A, single video frames (50-ms exposure) are shown for FL-M10 and NM-M2b transiently expressed in HeLa cells. Arrows indicate fluorescent spots, which are concentrated at the tips of filopodia for FL-M10 or on stress fibers in central regions of the cell for NM-M2b. B, averaged images obtained from 50 consecutive video frames from the same recordings shown in A (equivalent to 2.5-s total exposure) for FL-M10 and NM-M2b. FL-M10 does not localize to stress fibers, in marked contrast to NM-M2b. C, fluorescence intensity profile of FL-M10 measured along the length of a single filopodium (boxed in A). Arrows indicate fluorescent spots with intensities characteristic of a single fluorophore. D, fluorescence intensity profile of NM-M2b for a region along a single stress fiber (boxed in A) for NM-M2b. Arrows indicate that fluorescent spots are more variable in intensity than those seen for FL-M10 (shown in C). E, sequence of images shows intensity fluctuations of an individual fluorescent spot in a series of video frames originally captured at 20 frames/s (50-ms exposure). The highly magnified, 1 × 1 μm2, region located at the center of the FL-M10-expressing cell (shown in A and B) shows a fluorescent spot arriving at the basal plasma membrane, remaining bound at the membrane for several frames, before either unbinding or bleaching within a single video frame (the displayed images are 100 ms apart in time). F, intensity changes of the spot shown in E are plotted as a function of time. Asterisks indicate the initial and final frames shown in E. G, example of the MSD plotted against time interval (dt) for all fluorescent objects that were tracked from the record shown for FL-M10 in A.

