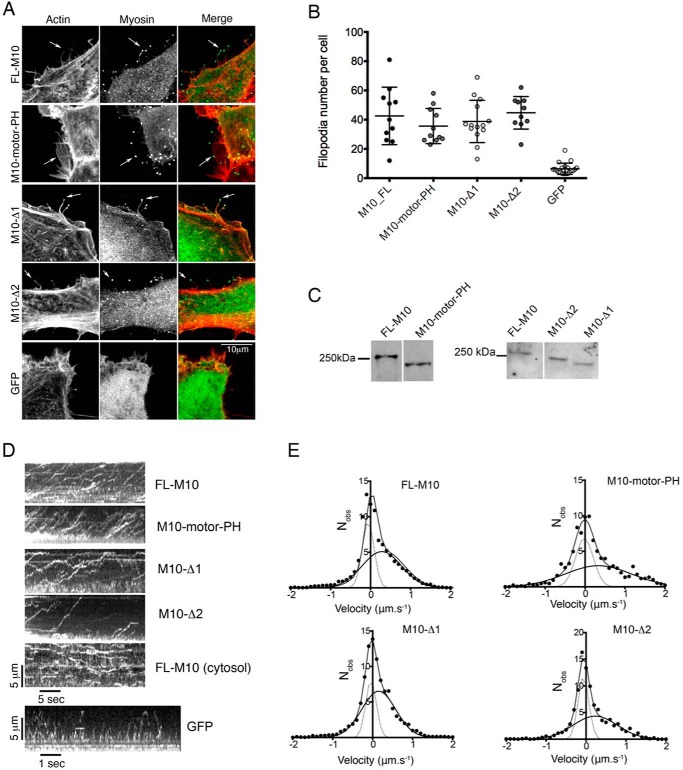
FIGURE 6.
Effects of M10 deletion constructs on filopodia number and velocity. In these experiments, M10 expression constructs in which either the C-terminal MyTH4-FERM domain (M10-motor PH) or the entire SAH/CC domain (M10-Δ1) were deleted or the ERK-rich region of the SAH (residues 815–851) were left intact and the remainder of the SAH domain/cc was deleted (M10-Δ2) were expressed in HeLa cells. A, all constructs accumulate at the tips of filopodia, as found for FL-M10. B, number of filopodia per cell, for each of the different constructs and for eGFP-expressing cells, are plotted with bars indicating mean and S.D. Filopodia number was counted for a minimum of 10 cells. The numbers of filopodia for each of the constructs is significantly higher (p < 0.01) than the number of filopodia in cells transfected with eGFP alone. C, Western blots of HeLa cells transfected with the FL-M10, M10-Δ1, M10-Δ2, and M10-motor-PH constructs. Bands detected with anti-eGFP antibody. D, top four kymographs show the trafficking of the different M10 expression constructs within filopodia (data for FL-M10 repeated from Fig. 4B). A kymograph was also constructed for a representative central region of a cell expressing FL-M10. The bottom kymograph, for GFP (eGFP) alone, moving within a filopodium, exhibits no fluorescence accumulation at the filopodial tip and shows rapid back-and-forth motion (note the faster time scale for this kymograph). E, distribution of immediate particle velocities determined from single particle tracking analysis over a running window of 10 video frames (500 ms time window) were determined for each construct (FL-M10, M10-motor-PH, M10-Δ1 and M10-Δ2) and histogrammed. The histograms were then fitted to the sum of two Gaussian functions.

