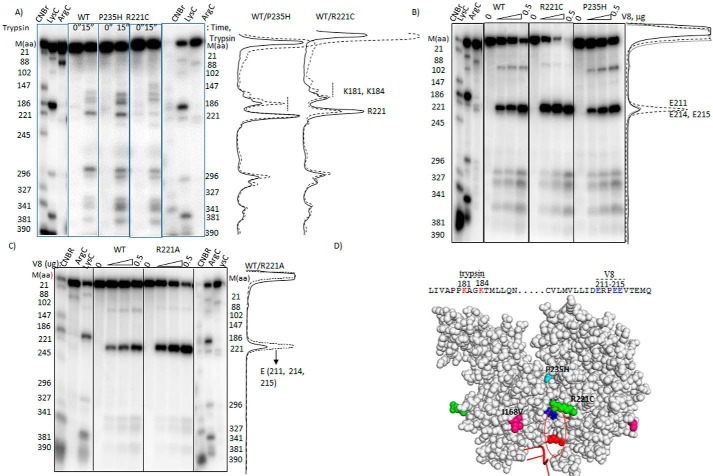
FIGURE 5.
Probing the conformational changes in the Rho* mutants. Autoradiograms showing the cleavage patterns of the radiolabeled WT and Rho* mutants in the presence of (A) trypsin and (B) V8 proteases under the indicated conditions. Profiles of the cleavage intensities are aligned with the patterns shown in the autoradiograms. In A for the ease of comparison, cleavage profiles of WT (—) and Rho* mutants (- - -) and in B for WT (—), R221C (- - -), and P235H (- - -) profiles are overlapped. The cleavage positions were identified from the proteolytic digestions with CNBr (at Met), Lys-C (at Lys), and Arg-C (at Arg) as indicated on the side of the autoradiograms. C, autoradiograms showing the V8 cleavage patterns of WT and R221A Rho mutant under the same conditions as above. The V8 cleavage sites were identified in similar ways as described above. Profile plots of the cleavage intensities are shown adjacent to the autoradiogram. D, the trypsin and V8 hypersensitive regions on the amino acid sequence of Rho are shown. These regions are also indicated on the structure of the Rho dimer (V8, blue; trypsin, red). Locations of the Rho* mutations are also indicated.

