FIGURE 6.
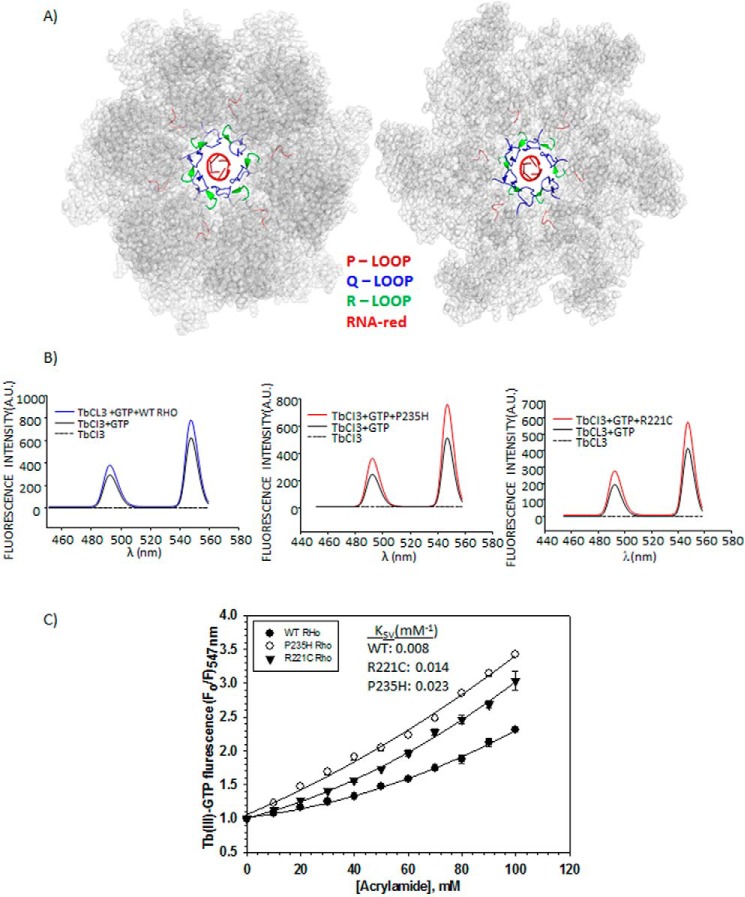
P-, Q-, and R-loops of Rho hexamer and TbCl3 fluorescence. A, crystal structure of Rho hexamer (PDB ID 3ICE) highlighting the functionally important loops and the RNA at the central channel by the indicated colors. B, fluorescence emission spectra of TbCl3 under different conditions as indicated. Two distinct peaks of the TbCl3 at 488 and 547 nm are visible. C, modified Stern-Volmer plots to determine the quenching constant (KSV) and the nature of quenching by a neutral quencher, acrylamide. F0 and F are the fluorescence intensities of Tb(III)-GTP bound to the ATP-binding site of the WT and Rho* mutants, in the absence and presence of different concentrations of acrylamide, respectively. Average KSV values are calculated from the initial slopes of the curves. Errors were calculated from two to three measurements.

