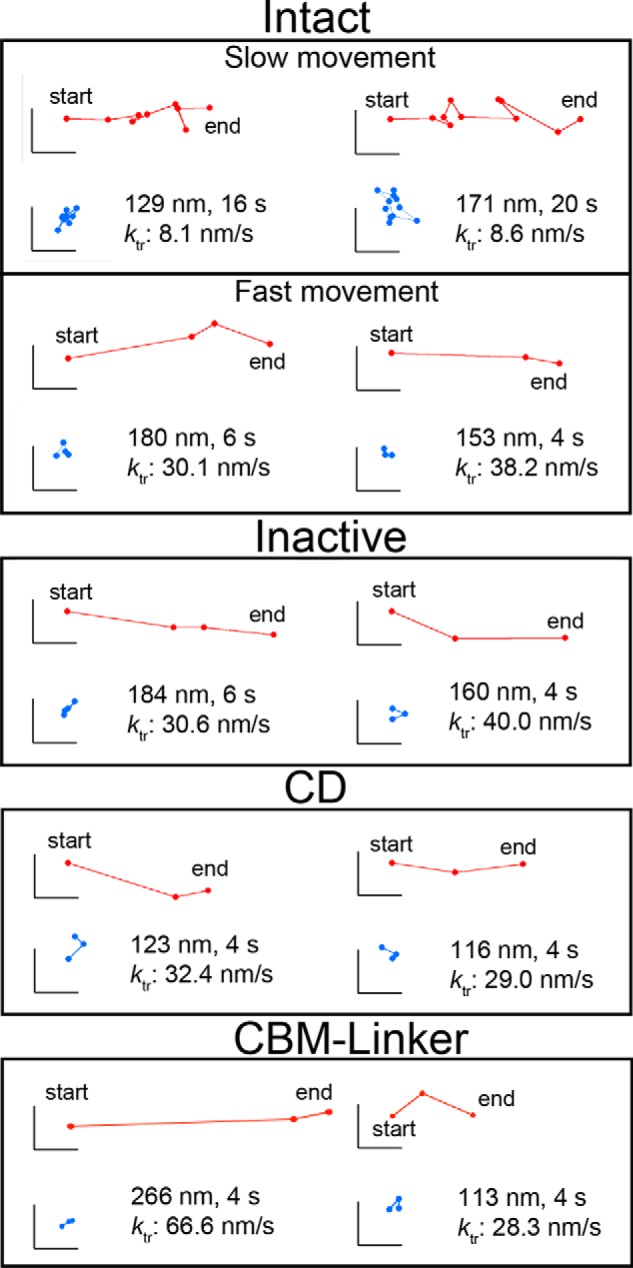
FIGURE 6.

Trajectories of the movement for Intact, Inactive, CD, and CBM-linker. The red plots show the centroid trajectory of the movement. The blue plots show the centroid trajectory of a non-moving molecule in the same field of view and demonstrate that the coverslip did not drift. The frame rate of observation was 0.5 fps. The scale bars are 40 nm for both the vertical and horizontal axes.
