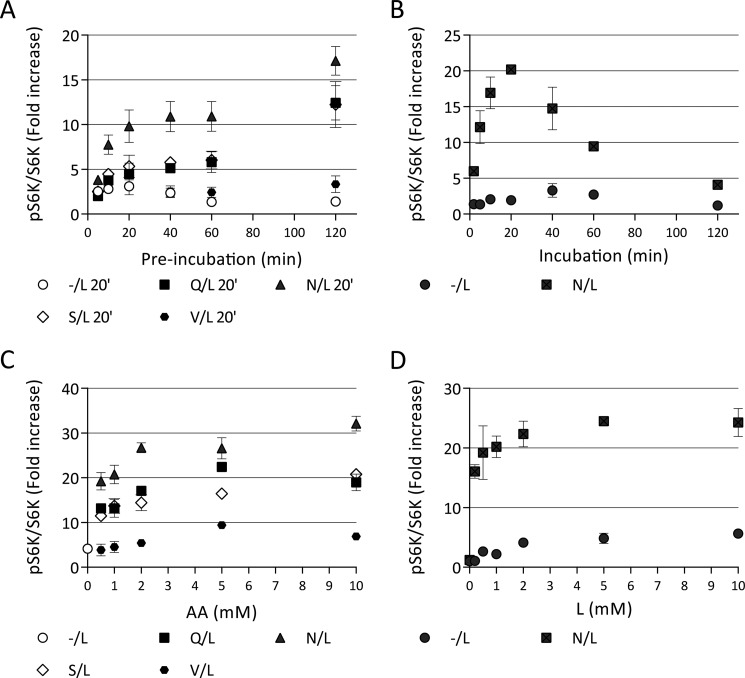
FIGURE 6.
Concentration ranges and time courses of the two phases of mTORC1 activation by amino acids. HeLa cells were starved before treatments in KRBH for 1 h. A, cells were preincubated in the absence (−) or in the presence of 5 mm priming amino acids (Gln, Asn, Ser, or Val) for times indicated. The cells were washed to remove amino acids and incubated with 5 mm Leu (L) for 20 min. B, cells were preincubated in the absence of amino acids (−) or in the presence of 5 mm Asn for 30 min. The cells were washed to remove amino acids and incubated with 5 mm Leu for indicated lengths of time. C, cells were preincubated in the absence (−) or in the presence of indicated concentrations of Gln, Asn, Ser, or Val for 20 min. The cells were washed to remove amino acids and incubated with 5 mm Leu for another 20 min. D, cells were preincubated in the absence of amino acids (−) or in the presence of 5 mm Asn for 30 min. The cells were washed to remove amino acids and incubated with indicated concentrations of L for another 20 min. The phosphorylation of S6K (Thr389) and total S6K were analyzed by immunoblotting. The means of pS6K/S6K are expressed as fold increase compared with starved cells. The data shown are representative of two independent experiments performed in duplicate (B) or triplicate (A, C, and D). The data with error bars represent means ± S.D.

