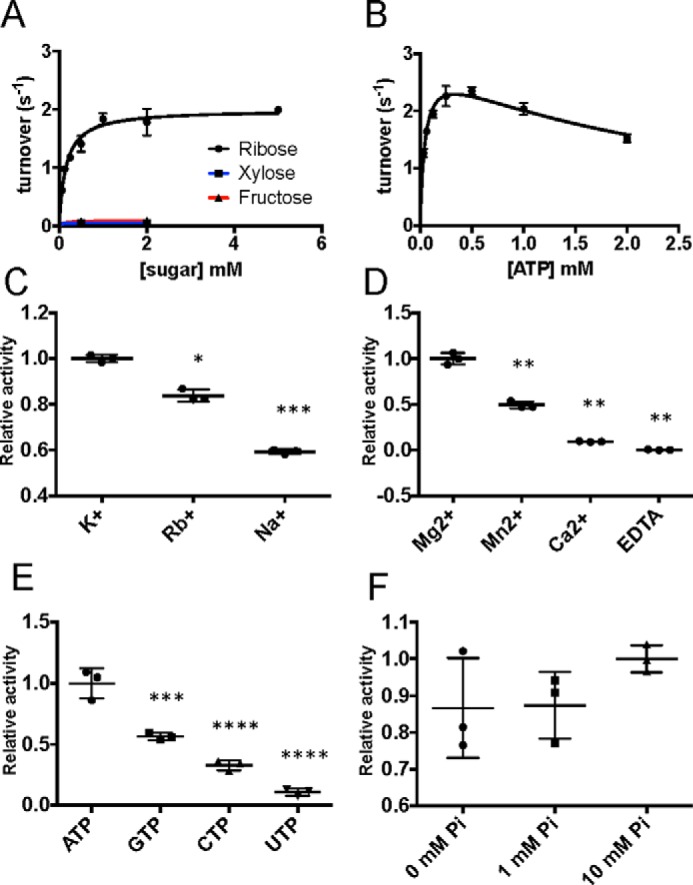
FIGURE 3.

At1g17160 is an active and specific RBSK. A, plot of initial reaction rates at increasing concentrations of ribose (black line), xylose (blue line), and fructose (red line). B, plot of initial reaction rates at increasing concentrations of ATP. C, scatter plot comparison of enzyme activity in the presence of 100 mm monovalent K+, Rb+, and Na+, normalized to K+. Asterisks indicate statistical difference from K+. D, comparison of enzyme activity in the presence of 10 mm Mg2+, Mn2+, Ca2+, or EDTA, normalized to MgCl2. Asterisks indicate statistical difference from Mg2+. E, comparison of enzyme activity in the presence of 0.5 mm nucleotide phosphate donors, normalized to ATP. Asterisks indicate statistical difference from ATP. F, comparison of enzyme activity at varying concentrations of inorganic phosphate. All experiments were performed in triplicate. Scatter plots show all data points with mean ± S.D. indicated. *, p < 0.05; **, p < 0.01; ***, p < 0.001; ****, p < 0.0001.
