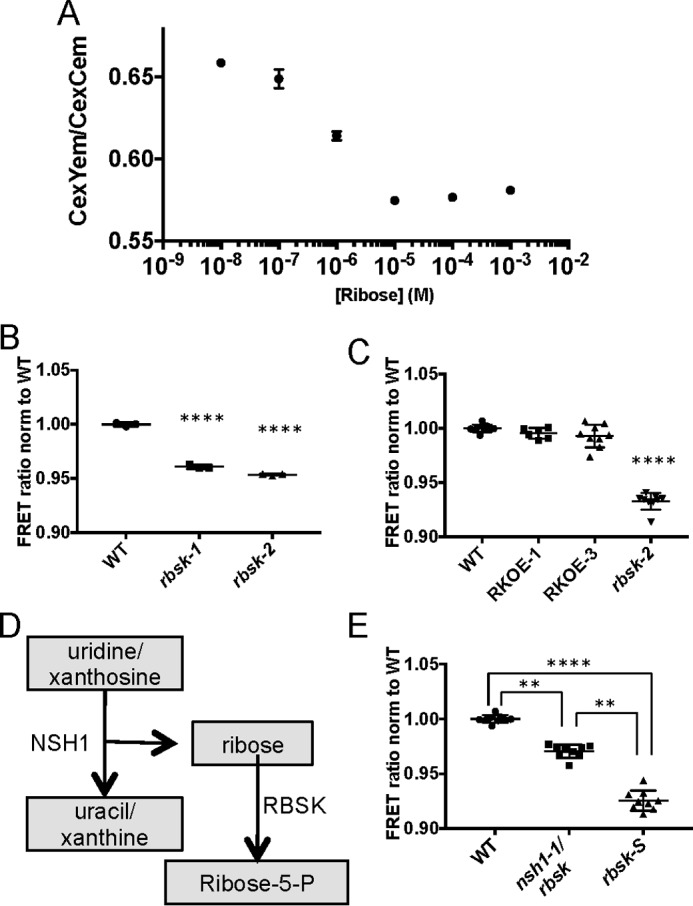
FIGURE 8.

Protein-based ribose sensors confirm ribose accumulation in rbsk-2. A, standard curve of ratio of YFP emission to CFP emission when excited by CFP excitation in ribose FRET sensors at indicated by ribose concentrations. Mean ± S.D. are shown of three technical replicates from a representative experiment. The experiment was repeated three times. B, comparison of FRET ratios, normalized to WT, in extracts from WT, rbsk-1, and rbsk-2 seedlings diluted 100-fold in FRET lysis buffer and added to crude FRET sensor lysate. This experiment was performed once and included three technical replicates each from two biological replicates of rbsk mutant seedlings and one biological replicate of a WT control. The mean ± S.D. of three technical replicates are shown. C, comparison of FRET ratios, normalized to WT, in extracts from WT, RKOE-1, and RKOE-3 diluted 100-fold in FRET lysis buffer and added to crude FRET sensor lysate. Experiments were performed three times, or two times in the case of RKOE-1. Each experiment included three technical replicates from each of two biological replicates from seedlings expressing 35S:RBSK-MYC in the rbsk-2 background and one biological replicate each of the parental rbsk-2 and WT control. All data points from all experiments are shown with mean ± S.D. indicated. D, pathway diagram of generation of ribose from NSH1 activity. E, comparison of FRET ratios, normalized to WT, in extracts from WT, rbsk nsh-1, and rbsk-S, diluted 100-fold in FRET lysis buffer and added to crude FRET sensor lysate. Experiments were performed three times each. Each experiment included three technical replicates from one biological replicate each of rbsk nsh-1 double mutant, rbsk-s single mutant, and WT control seedlings. All data points from each of the three experiments are shown with mean ± S.D. indicated. All asterisks indicate statistical difference from WT unless otherwise noted. **, p < 0.01; ****, p < 0.0001.
