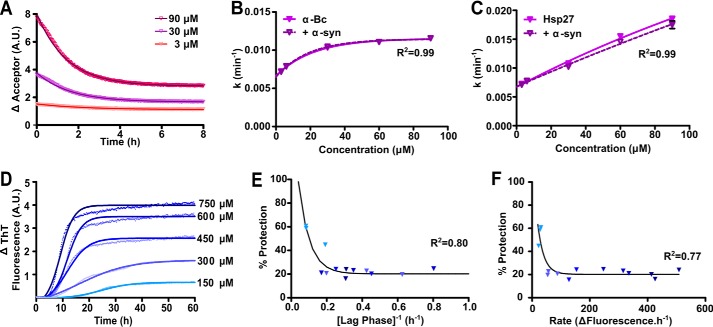
FIGURE 5.
The ability of αB-c to inhibit the fibrillar aggregation of α-syn is dependent on the kinetics of aggregation. A, fluorescently labeled αB-c was incubated for 1 h at 37 °C in PBS (pH 7.4) at concentrations ranging from 3 to 90 μm, consisting of an equimolar mixture of fluorescently labeled protein capable of FRET. Samples were diluted 10-fold into unlabeled αB-c, in the absence or presence of α-syn at a 1:10 (αB-c:α-syn) molar ratio, and the loss of fluorescence in the acceptor fluorescence channel was used to calculate: B, the rate of subunit exchange in the absence and presence of α-syn; C, the rate of subunit exchange was similarly calculated for Hsp27, in the absence and presence of α-syn. D, recombinant A53T α-syn was incubated at concentrations ranging from 150 to 750 μm in 50 mm phosphate buffer containing 100 mm NaCl and 0.01% NaN3 (pH 7.4), in the presence or absence of a 1:10 molar ratio of αB-c. Samples were incubated at 37 °C for 60 h and aggregation was monitored via the change in ThT fluorescence at 490 nm. A representative plot is shown for α-syn in the absence of αB-c with Boltzmann-sigmoidal curves fitted to the data. Values obtained from D were used to calculate the lag phase, elongation rate, and plateau phase for each α-syn concentration. The percent protection afforded by αB-c when present in the sample was calculated and correlated with the (E) duration of the lag phase and (F) rate of elongation. Symbols represent the calculated parameters from each of three independent repeats, with each point corresponding to values calculated from a fit of triplicate samples and shaded according to the concentration of α-syn as indicated in panel D. Data in B, E, and F were fitted with a non-linear regression model and data in C were fitted with a linear regression model. The R2 coefficients of determination are shown.

