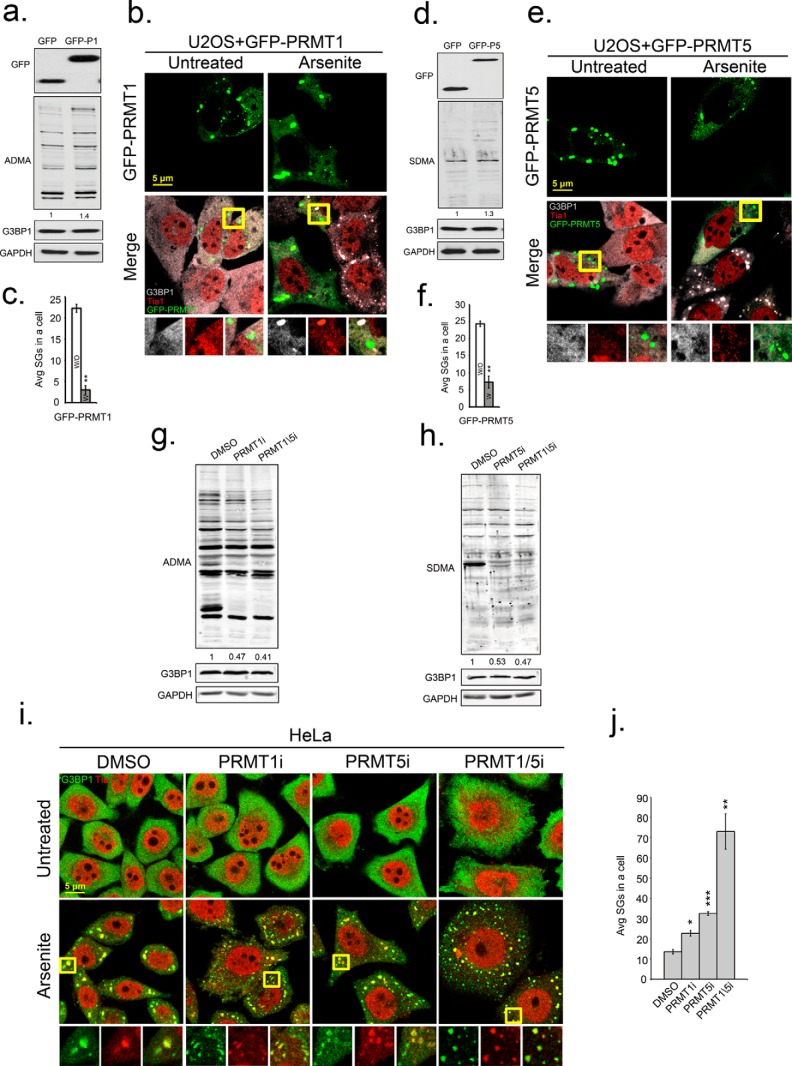
FIGURE 3.
Enzymatic activity of PRMT1 and PRMT5 suppresses SG formation. U2OS cells were transfected with GFP, GFP-PRMT1, or GFP-PRMT5. Antibodies specific for GFP (top panels in a and d), asymmetric (ADMA) methyl modifications (a and g), and symmetric methyl modifications (SDMA) (b and h) were used in Western blot analysis. b and e, to measure effects of PRMT overexpression on SGs, cells expressing PRMT1 or PRMT5 were stressed with arsenite and processed for IFA with antibodies against G3BP1 in gray and Tia1 in red. c and f, bar graphs represent average number of SGs/cell in cells that did express (white bars) or did not express transgenes (gray bars), **, p < 0.01. i, enzymatic activities of PRMTs in HeLa cells were inhibited by PRMT1 inhibitor (PRMT1i), PRMT5 inhibitor (PRMT5i) or both together (PRMT1/5i). HeLa cells were fixed after arsenite treatment and stained for SG markers G3BP1 in green and Tia1 in red. Yellow squares indicate regions depicted in vignettes, and the merged channel vignette is on the right of each series of three panels. j, quantification of average SGs/cell after inhibitor treatments. *, p < 0.05; **, p < 0.01; and ***, p < 0.001 versus DMSO-treated cells. The results shown are representative of three independent experiments in which 100 cells were counted in each. Original magnification: 63×.

