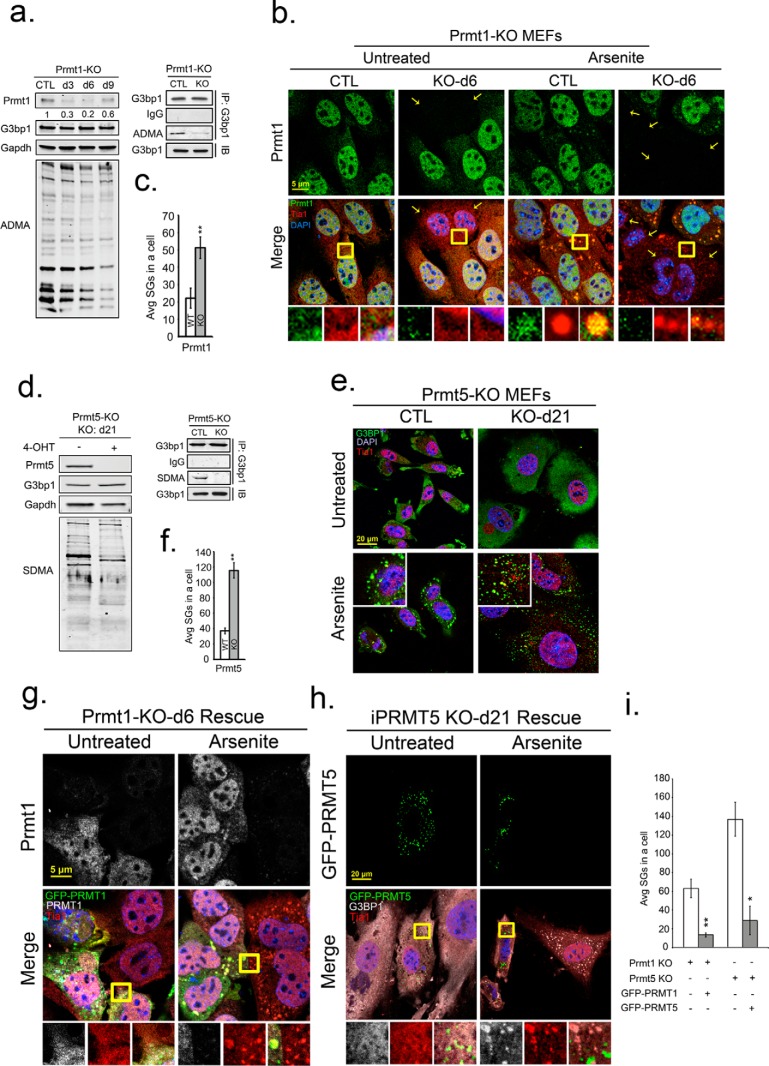
FIGURE 4.
Knockdown of PRMT1 or PRMT5 promotes SG assembly. Inducible PRMT1 (PRMT1-KO) and PRMT5 (PRMT5-KO) knock-out MEFs were treated with 4-OHT for 6 and 21 days, respectively, to deplete PRMT1 and PRMT5. a and d, endogenous PRMT1, PRMT5, G3BP1 protein levels, and methylation status of total proteins was determined by Western blot with antibodies against PRMT1, PRMT5, G3BP1, asymmetric (ADMA), or symmetric (SDMA) dimethylarginine as indicated. GAPDH protein levels serve as loading controls (a, d). b, PRMT1-KO MEFs were assessed for knock-out efficiency and effect on methylation (small panel shown in a), arsenite treated and processed for IFA with antibodies against PRMT1 in green, Tia1 in red, and DAPI in blue. Average SGs/cell were quantified before or after PRMT1 KO (c; white versus gray bars). **, p < 0.01. e, similarly, PRMT5-null MEFs (shown by small panel in d, were arsenite treated and processed for IFA. Cells were counterstained for G3BP1, Tia1, and DAPI, and the average SGs/cell were quantified with or without PRMT5 KO (f), **, p < 0.01 versus untreated PRMT5-KO MEFs. (g) and (h), PRMT1 and PRMT5 expression was rescued in PRMT-KO MEFs by transfection of GFP-tagged PRMT expression constructs. Cells were arsenite treated, fixed, and stained in IFA for PRMT1 in gray (g, top panels), G3BP1 in gray (h), Tia1 in red, and DAPI. Yellow squares indicate regions depicted in vignettes. Prmt1 KO was always incomplete, thus staining for both endogenous and transgene Prmt1 is shown (i). Quantification of average SGs/cell in rescue experiments with PRMT KO MEFs (white bar), and PRMT KO rescued MEFs (gray bar). *, p < 0.05; **, p < 0.01 versus PRMT-KO MEFs. The results shown are representative of three independent experiments counting >100 cells in each. Original magnification: 63×.

