FIGURE 3.
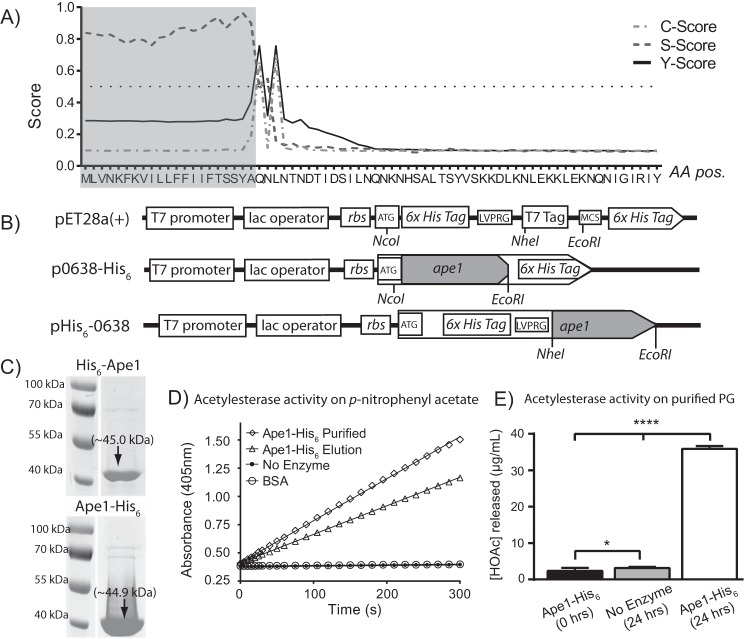
A, SignalP 4. 1 server (83) output for signal peptide prediction of in-frame translation of Cjj-81-176_0638. C-score (the predicted first amino acid of the mature protein), S-score (the likelihood that a particular amino acid is part of a signal peptide), and Y-score (amino acid with a high C-score exhibiting the greatest change in the S-score) predicted the cleavage site to be between the 21st and 22nd amino acids. B, Cjj81-176_0638 was cloned in-frame without the signal peptide into pET28a(+) protein expression vectors. Top, map of cloning sites in pET28a(+) commercial expression vector. Middle, Ape1-His6 expression construct. NcoI and EcoRI were used to produce a C-terminal His6-tagged Ape1 protein that uses ATG start codon and TGA stop codon encoded in the vector. Bottom, His6-Ape1 expression construct. NheI and EcoRI were used to produce an N-terminal His6-tagged protein that uses AUG start codon encoded by the vector and the original stop codon from Cjj81-176_0638. rbs, ribosome-binding site; LVPRG, thrombin cleavage site; MCS, multiple cloning sites. Gene organization not to scale. C, His6-tagged Ape1 after nickel-nitrilotriacetic acid-agarose purification shows protein of the predicted size (45.0 and 44.9 kDa for His6-Ape1 and Ape1-His6 respectively) in eluted fractions after SDS-PAGE analysis. D, purified Ape1-His6 exhibits acetylesterase/deacetylase activity using pNPAc as a substrate (45). Reactions were monitored over 5 min as a change in the absorbance at 405 nm (formation of p-nitrophenol) after cleavage of the acetyl group. No enzyme control and BSA control are overlapping and show no acetylesterase activity. Results shown are from one protein purification experiment. Results are reproducible for each expression and purification experiment, and activity was routinely assessed before performing enzymatic assays on PG. E, Ape1-His6 has acetylesterase activity using PG muropeptides as a substrate. Determination of acetic acid concentration after treatment of Δape1 PG with Ape1-His6 for 24 h was performed using Megazyme acetic acid assay kit. Treatment and no enzyme control were compared with acetic acid concentration at 0 h of treatment using Student's t test with * and **** indicating p values of <0.05 and <0.0001, respectively. Results are from one representative experiment of two biological replicates performed in triplicate.

