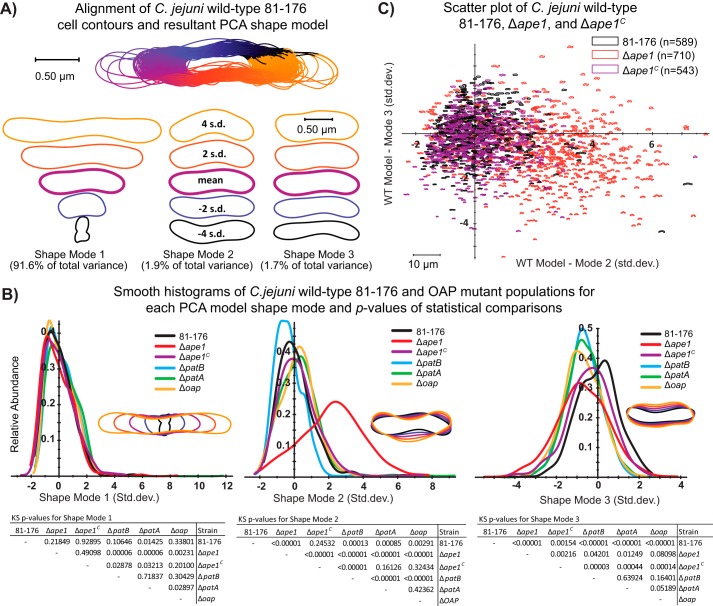
FIGURE 5.
CellTool analysis of wild-type strain 81-176, Δape1, Δape1C, ΔpatB, ΔpatA, and Δoap population morphology. Differential interference contrast images were taken of strains grown for 7 h in MH-TV broth at a starting A600 of 0.05 (to mid-exponential phase). Images were converted to binary format (white cells on a black background), and lumps and artifacts were manually removed before processing with CellTool “extract contours function” to generate contours representing each cell (53). A, contour extraction, alignment, and generation of the PCA shape model for C. jejuni wild-type strain 81-176. CellTool “align contours” function was used to align the contours of the wild-type population to one another. B, PCA was performed to generate a wild-type shape model that explains 95% variation in the population in principal components called “shape modes.” Shape modes 1, 2, and 3 represent variation in length, curvature/wavelength, and width, respectively. The extracted contours of the mutant populations were then aligned to the wild-type shape model, and a measurement representing the normalized standard deviation from the wild-type mean in each shape mode was generated and depicted graphically. KS tests were performed for each shape mode between each population and are summarized below the plots. C, measurements of wild type, Δape1, and Δape1C were plotted with shape mode 2 along the x axis and shape mode 3 along the y axis to create a scatterplot showing the variation in the different populations.

