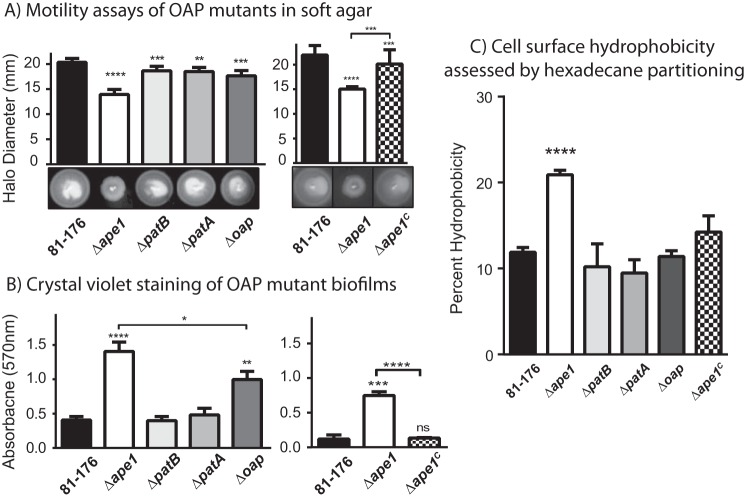
FIGURE 6.
Motility in soft agar, biofilm formation, and cell surface hydrophobicity of OAP mutants and wild-type strain 81-176. A, Δape1 exhibits a 30% decrease in halo diameter and abnormal halo formation (rough edges). Motility in soft agar was assessed by measuring the halo diameter after 24 h of strains point-inoculated in 0.4% semi-solid agar. Representative images of halos are shown below each graph. Results shown are representative of one of three independent experiments with 6 replicates. Each strain was compared with wild-type using a paired Student's t test, with **, ***, and **** indicating p < 0.01, p < 0.001, and p < 0.0001. B, Δape1 and Δoap exhibit 5.5- and 2.5-fold enhanced biofilm formation, respectively, at 24 h. Biofilm formation was assessed after 24 h by crystal violet staining of standing cultures in borosilicate tubes and spectrophotometric quantification of dissolved crystal violet at 570 nm. Results shown for the mutants (left) are representative of one of three independent experiments carried out in triplicate. The results for Δape1C (right) are representative of one of two experiments performed in triplicate. ns, not significant. C, Δape1 exhibited a 2.0-fold increase hydrophobicity relative to wild type, as assessed by hexadecane partitioning. Results are representative of one of three independent experiments performed in triplicate. For biofilm and hydrophobicity, strains were compared using an unpaired Student's t test, with *, **, ***, and **** indicating p < 0.05, p < 0.01, p < 0.001, and p < 0.0001. Error bars represent standard deviation.

