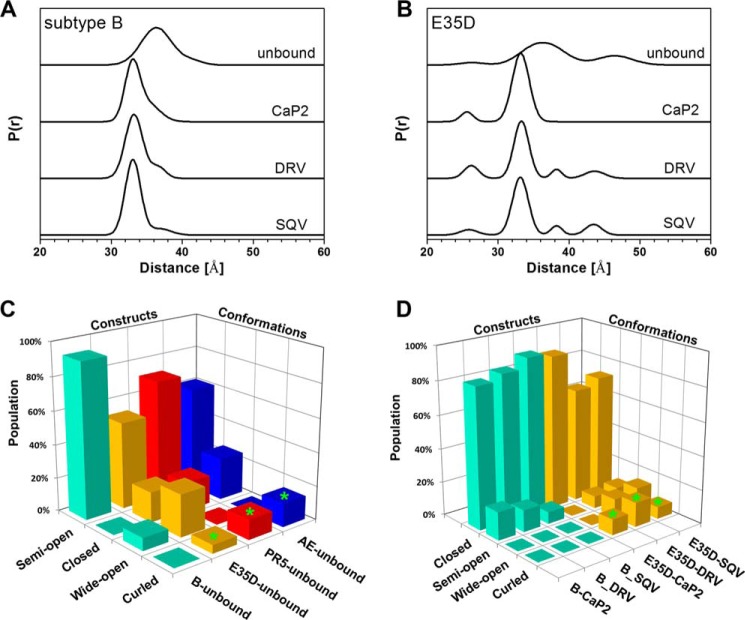
FIGURE 2.
DEER distance profiles show conformational sampling results for unbound, CaP2-bound, DRV-bound, and SQV-bound subtype B (A) and E35D (B). Bar graph comparison of relative percentages (e.g. fractional occupancies) of each conformational state in subtype B, E35D, PR5, and CRF01_AE constructs in unbound form (C) and CaP2-, DRV-, and SQV-bound forms (D). Protein conformational population data of PR5 and CRF01_AE are taken from Refs. 30, 32, 33, 47, 87.

