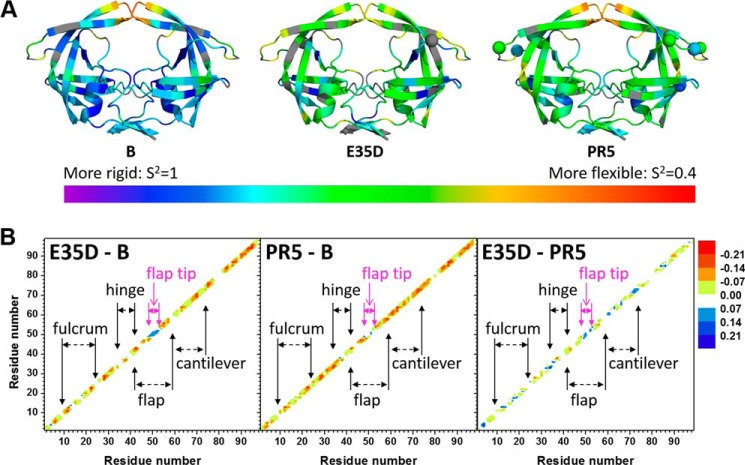
FIGURE 3.
A, ribbon diagrams of HIV-1 PR (PDB code 1HHP) color-coded according to NMR-derived values of order parameters ranging from 1 (rigid in violet) to 0.4 (flexible in red). Gray indicates the absence of NMR data for those residues. The locations of natural polymorphisms are shown as spheres. B, difference plots of the backbone order parameters comparing E35D to subtype B (E35D-B), PR5 to subtype B (PR5-B), and E35D to PR5 (E35D-PR5). Negative numbers (indicated by red coloring) indicate greater dynamics at that site. The NMR-derived parameter values are given in supplemental Fig. S10.

