FIGURE 9.
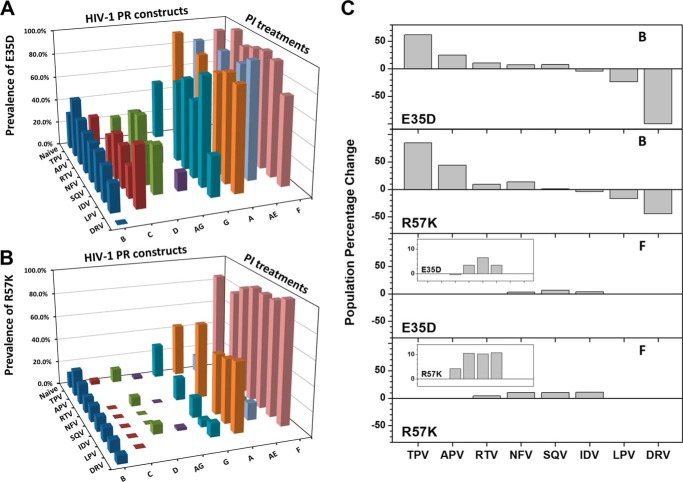
Bar graphs of the prevalence of E35D (A) and R57K (B) as natural polymorphisms in HIV-1 PR subtypes and CRFs are shown, and data are not shown when the total number of isolates is smaller than 5. C, population percentage change (δP%) of the E35D and R57K natural polymorphisms under PI treatments, where δP% = (P(in PI-treated patients) − P(in drug-naive patients))/(P(in drug-naive patients)) × 100. The insets show the enlarged bar graphs of subtype F. Data were not included for TPV-, APV-, lopinavir-, and DRV-treated subtype F patients due to the limited number of DNA sequences.

