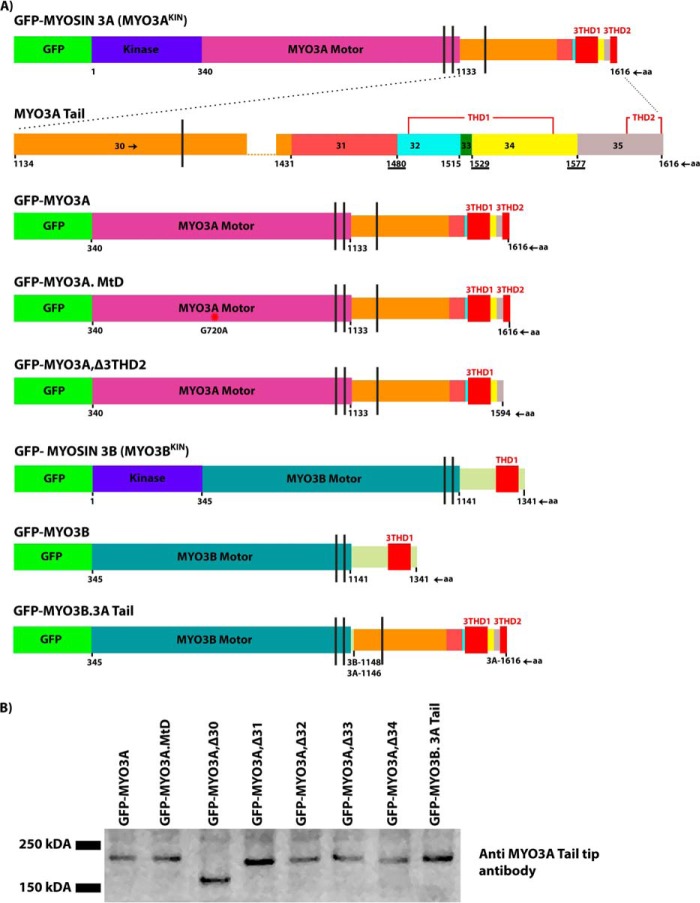
FIGURE 1.
Diagrammatic representation of the domain structure of class III myosins and the COS7 cell expression of various constructs. A, schematic map including kinase domain, motor domain, IQ motifs, THD1, and THD2 of various MYO3A and MYO3B constructs used in this study. The amino acid residue number is shown at the start and end of each domain. The vertical black lines represent IQ motifs. MYO3A tail magnified diagram shows that the exon 30-amino acid sequence length is greater than that of combined sequences of exons 31–34. To represent the diagram to scale and to highlight all the features, complete exon 30 is not shown. Overlapping residues between exons 31–32, 33–34, and 34–35 in the MYO3A tail sequence are underlined. Diagrams are drawn to scale. B, Western blot of COS7 lysates expressing various MYO3 constructs probed with anti MYO3A tail tip antibody. Predicted molecular masses (in Da) are as follows: MYO3A, 182,230; MYO3A,Δ30, 148,080; MYO3A,Δ31, 176,370; MYO3A,Δ32, 177,910; MYO3A,Δ33, 180,350; MYO3A,Δ34, 176,480; and MYO3B.3A Tail, 176,290.

