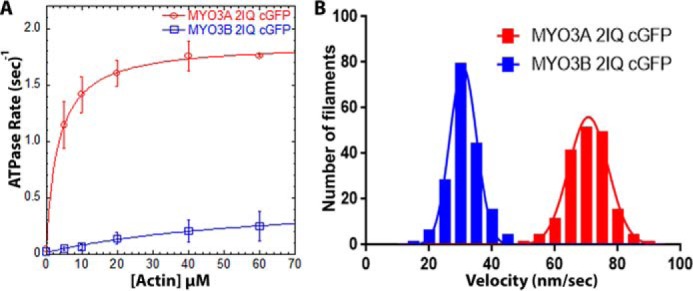
FIGURE 2.

Actin-activated ATPase and in vitro motility properties of MYO3A and MYO3B. A, steady state actin-activated ATPase rate was measured and plotted as a function of actin concentration and fit to the Michaelis-Menten equation to determine kcat and KATPase. Error bars represent standard deviation. B, in vitro motility assay was performed with the same constructs, and the actin filament sliding velocity was determined (n = 177 filaments). ATPase and in vitro motility data were reported from at least two protein preparations and 2–3 independent experiments. The velocities for each construct were fit to a Gaussian distribution, and the mean velocity was determined. See Table 1 for summary of ATPase and motility values.
