FIGURE 3.
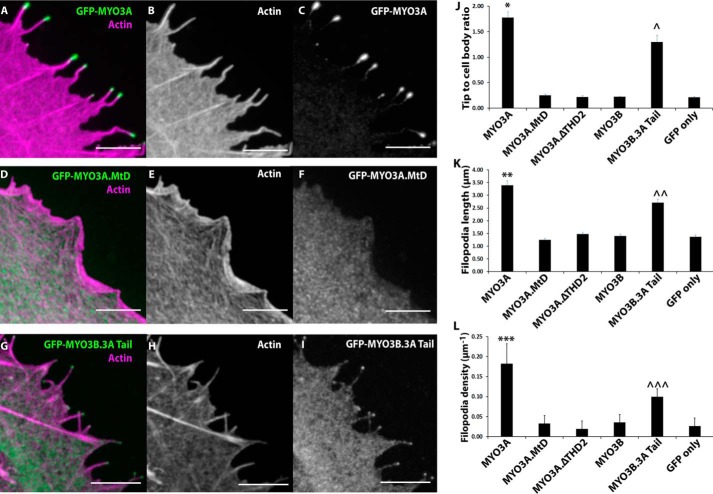
Role of MYO3A motor domain and THD2 in actin protrusion formation and elongation. Representative confocal images of paraformaldehyde-fixed and phalloidin-stained COS7 cells transfected with GFP-MYO3A (A–C), GFP-MYO3A.MtD (D–F), and GFP-MYO3B.3A Tail (G–I) (left panel, merged GFP-MYO3 (red) and 568-phalloidin actin (blue); middle panel, phalloidin-568 actin; right panel, GFP-MYO3). Scale bar, 5 μm. J, MYO3A exhibited significantly higher tip localization (*, p < 0.01) compared with all the other constructs. MYO3B.3ATail demonstrated tip localization greater than MYO3A.MtD, MYO3A.ΔTHD2, MYO3B, and GFP only (∧, p < 0.0001). A similar trend was observed in filopodia length (K) and filopodia density (L) measurements. MYO3A-expressing cells demonstrated the highest filopodia length (K, **, p < 0.0001) and density (L, ***, p < 0.0001). MYO3B.3ATail-expressing cells exhibited enhanced filopodia length (K, ∧∧, p < 0.001) and density (L, ∧∧∧, p < 0.0001) compared with MYO3A.MtD, MYO3A.ΔTHD2, MYO3B, and GFP only. J, filopodia tip to cell body ratio plot (J) and filopodia length plot (K) error bars indicate mean ± S.E. Error bars in the filopodia density plot (L) indicate mean ± S.D. For all the parameters, data were collected from ≥60 filopodia from ≥10 cells for each condition in three independent experiments. Numerical data are shown in Table 2.

