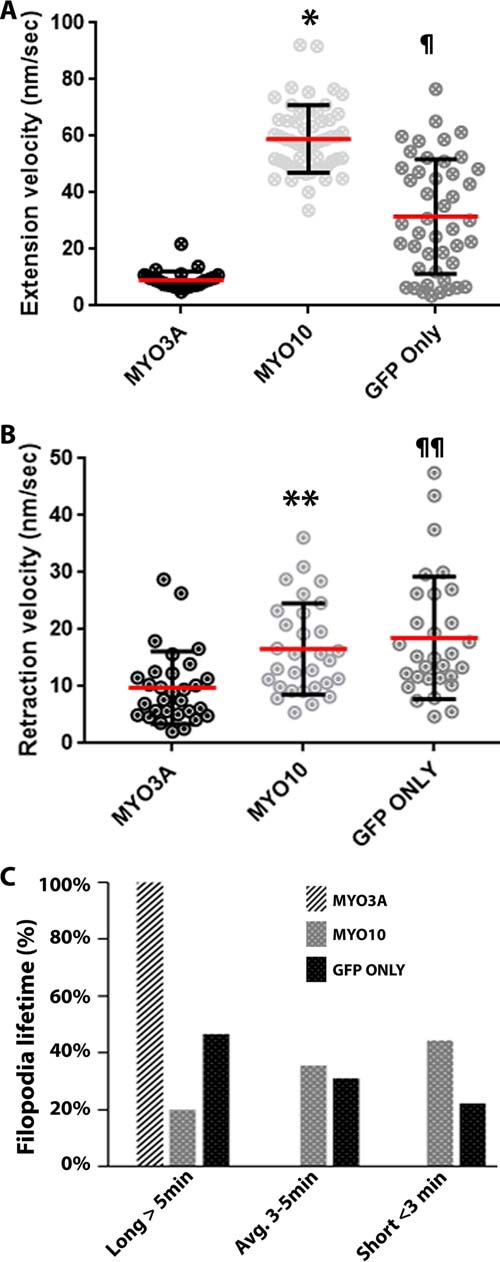
FIGURE 4.

Impact of MYO3A on actin protrusion dynamics. A, scattered dot plots showing the filopodia extension velocities of MYO3A-, MYO10-, and GFP only-expressing COS7 cells. MYO10-expressing cells exhibited the highest filopodia extension velocity (*, p < 0.0001). GFP only-expressing cells had a filopodia extension velocity greater than MYO3A (¶, p < 0.0001) (extension velocity (nm/s): MYO3A, 8.78 ± 3.39; MYO10, 58.97 ± 11.91; GFP only, 21.46 ± 15.10. B, scattered dot plot showing the filopodia retraction velocity of MYO3A-, MYO10-, and GFP only-expressing COS7 cells. MYO10 and GFP only exhibited significantly greater retraction velocity compared with MYO3A (**, p < 0.01, and ¶¶, p < 0.001, respectively) (retraction velocity (nm/s): MYO3A, 9.76 ± 6.38; MYO10, 16.59 ± 8.00; GFP only, 18.51 ± 10.76). Extension and retraction velocity data were collected from ≥31 filopodia from ≥10 cells for each condition in three independent experiments. Scattered dot plots are shown as mean ± S.D., and the mean is represented by a red line. C, quantification of filopodia lifetimes by live-cell imaging of COS7 cells expressing the indicated GFP-tagged constructs. MYO3A-expressing cells exhibited protrusions with a longer lifetime (>5 min) compared with MYO10- and GFP only-expressing cells. Data were collected from 45 filopodia from ≥7 cells for each condition in three independent experiments.
