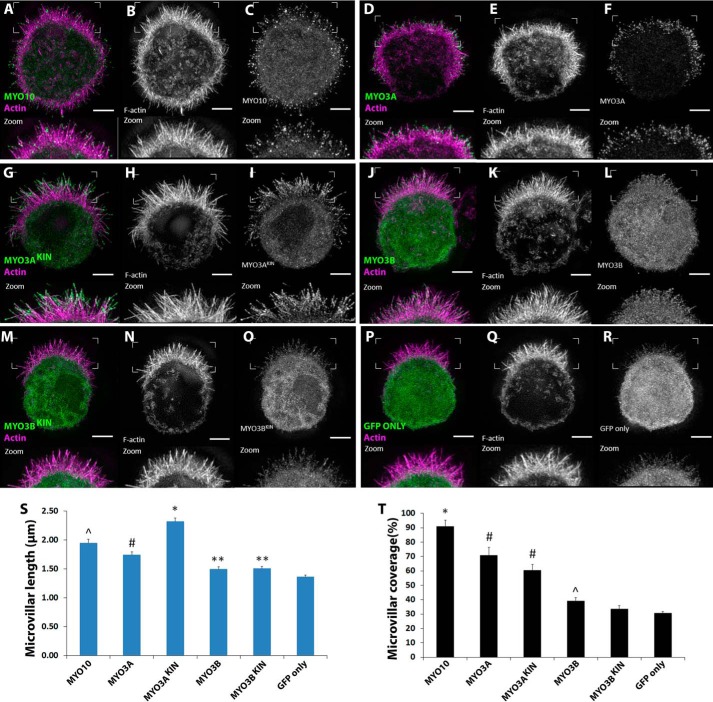
FIGURE 5.
Impact of MYO3A on microvilli formation and elongation in W4 cells. A–R, range of GFP-tagged MYO3 and MYO10 constructs were transfected in induced W4 cells and imaged using super-resolution structured illumination microscopy to examine their microvilli formation and elongation activity. The zoomed in image of the surface features are shown at the bottom of each panel. In the merged image, actin is shown in magenta and MYO3/MYO10 shown in green. Scale bar, 3 μm. S, MYO3AKIN exhibited the highest microvilli length compared with the other constructs (*, p < 0.001). MYO10 demonstrated longer microvilli compared with MYO3A, MYO3B, and GFP only constructs (∧, p < 0.01). MYO3A demonstrated longer microvilli length compared with MYO3B constructs and GFP only (#, p < 0.001), whereas MYO3B constructs showed longer microvilli length compared with GFP only (**, p < 0.02). T, MYO10 expression resulted in the highest microvillar coverage (*, p < 0.01). Expression of MYO3A constructs resulted in microvillar coverage greater than MYO3B constructs and GFP only, whereas MYO3B constructs induced microvillar coverage greater than GFP only (∧, p < 0.05). Data were collected from ≥54 microvilli from ≥9 cells in two independent sets of experiments. Error bars in both the plots indicate mean ± S.E. Numerical data are shown in Table 2.

