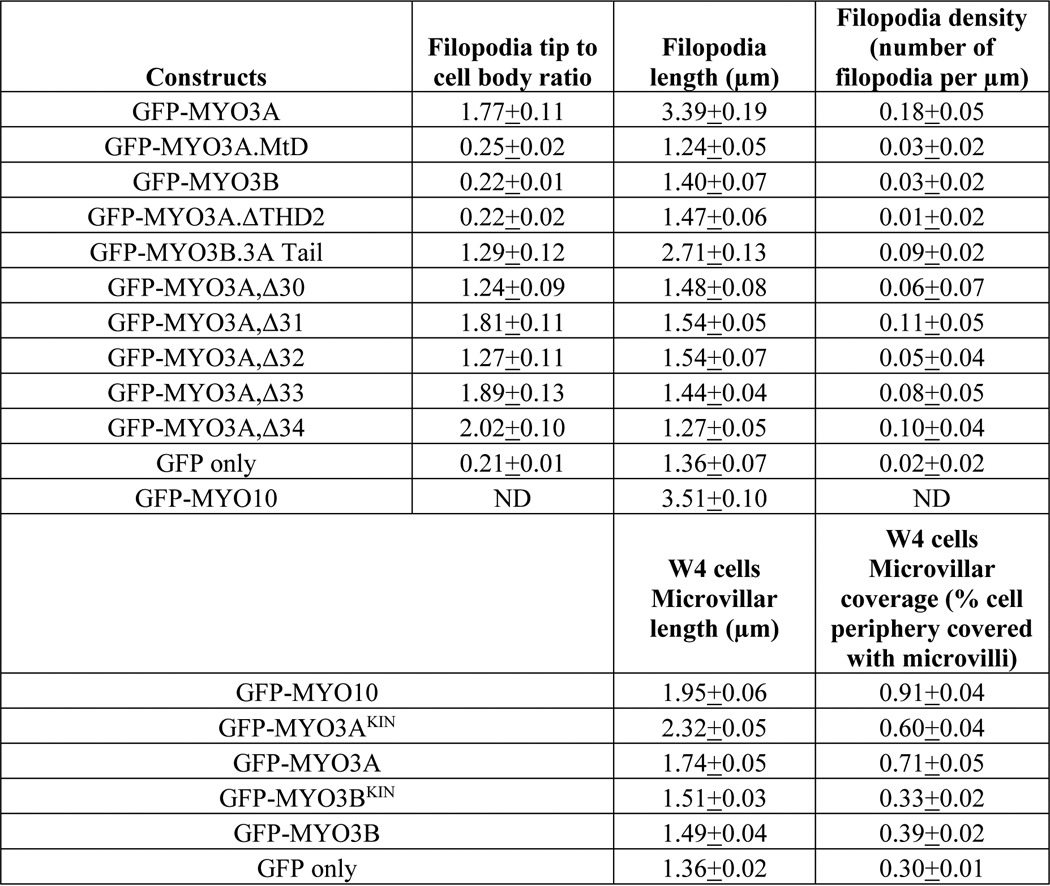
TABLE 2.
Summary of parameters used to quantify MYO3-associated actin protrusions
Filopodia tip to cell body ratio and filopodia length values are presented as mean ± S.E. Filopodia density values are presented as mean ± S.D. Filopodia data were collected from >60 filopodia from >10 cells for each condition in three independent experiments. Statistical comparisons are shown in respective data figures. ND, not determined.

