Figure 3.

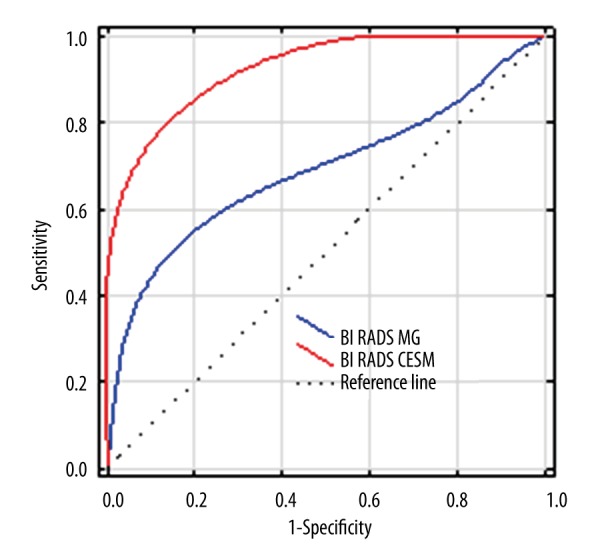
Comparison of ROC curves for CESM (red line) and MG (blue line). Dashed line is the reference line representing the ROC curve for a random decision (coin flip) about the positivity of each case (i.e., a useless test).

Comparison of ROC curves for CESM (red line) and MG (blue line). Dashed line is the reference line representing the ROC curve for a random decision (coin flip) about the positivity of each case (i.e., a useless test).