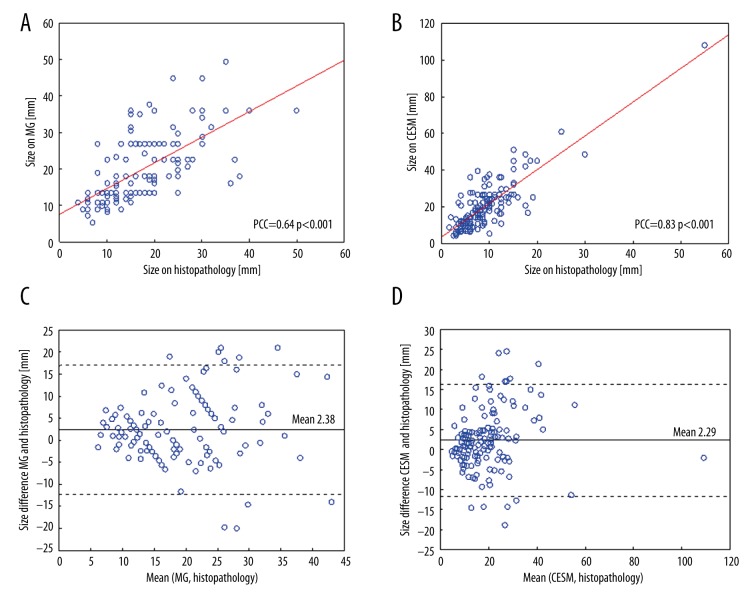
Figure 4.
Comparison of lesion diameters estimated based on histological examination, MG, and CESM. Scatterplots and Pearson’s correlation coefficients (PCC) of diameters assessed (A) with mammography and histological examination and (B) CESM and histology. (C) Bland-Altman plots for the comparison of diameter difference between MG and histological examination and (D) diameter difference between CESM and histological examination. Continuous lines in (C) and (D) represent the mean differences between measurements, the dotted lines represent upper and lower limits of means + or –1.96 times the standard deviation of differences.

