. 2016 Oct 3;5:e20252. doi: 10.7554/eLife.20252

Figure 4. Morphological analysis of identified active and silent granule cells.

(A) Somatodendritic reconstructions of silent (left, cell id 993) and active (right, cell id 102) GCs, recorded in freely moving rats. Dendritic branch orders 1–3 are indicated in black, while high-order branches (≥ 4) are indicated in red. Scale bar=50 µm. (B) Dendrograms for the cells in (A). The branch orders of the terminal dendritic tips are indicated. Color codes same as in (A). Scale bar=50 µm. (C) Box-plots comparing primary dendritic parameters (active GCs, n=6; silent GCs, n=7). Whiskers represent 1.5 IQR. Outliers are shown as crosses. (D) Weights of logistic regression classifier (mean ± SEM over cross-validation folds) used for classifying GCs as active or silent for different levels of sparseness (α=0.05 corresponds to dense weights, α=0.95 corresponds to sparse weights).

DOI: http://dx.doi.org/10.7554/eLife.20252.007

Figure 4—source code 1. Classification analysis.
Matlab script to load Figure 4—source data 1, run the logistic regression classification analysis on primary morphological features (Figure 4D), perform the shuffle analysis and run the control analysis with all morphological features.
DOI: 10.7554/eLife.20252.008
Figure 4—source data 1. Electrophysiological and morphological parameters of the identified GCs.
The table summarizes the main electrophysiological and morphological properties of the identified and reconstructed silent and active GCs (source data for Figure 4). Morphologies of the neurons are shown in Figure 4—figure supplement 1.
DOI: 10.7554/eLife.20252.009

Figure 4.

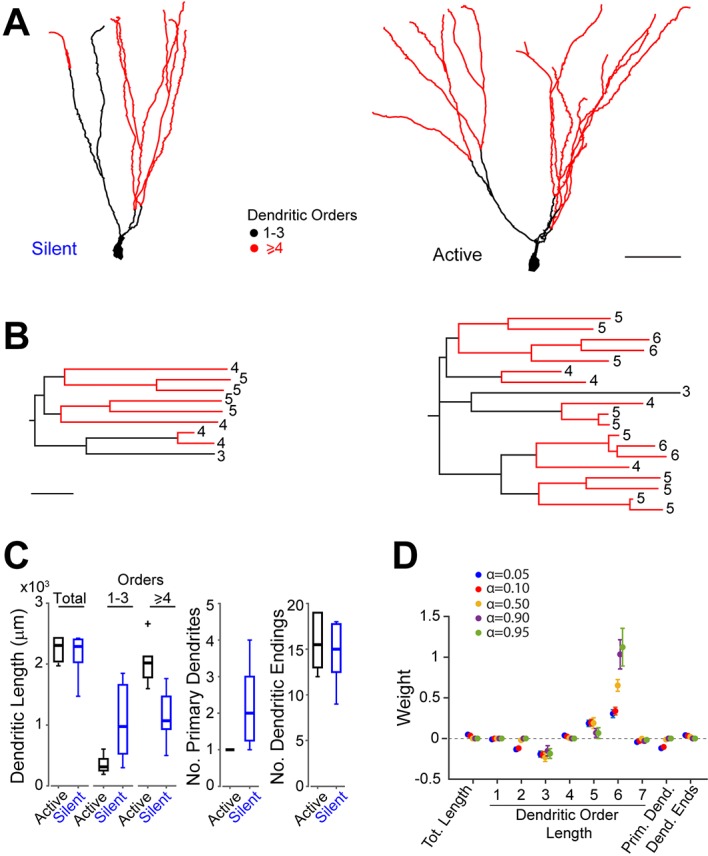
Figure 4—figure supplement 1. Morphological reconstructions of GCs recorded and labeled in freely moving rats.

Figure 4—figure supplement 1.

(A, B) Morphological reconstructions of silent (A) and active (B) GCs, recorded in freely moving rats. Dendritic branch orders 1–3 are indicated in black, while high-order branches (≥4) are indicated in red (same color-code as in Figure 4A). The insets show close-up magnifications of the soma and the proximal dendrites of each cell (first-order dendrites are in blue, second-order in green, third-order in orange and fourth-order in magenta). Scale bars=100 µm for the low magnification and 10 μm for the insets. Cell ids are indicated.

Figure 4—figure supplement 2. Distribution of recordings across animals and quantification of single-cell labeling quality.

Figure 4—figure supplement 2.

(A) Histogram showing the distribution of active (red) and silent recordings (blue) across animals (only recordings lasting > 60 s are included in the analysis; see Materials and methods). Identified recordings are indicated by the corresponding ids. Note that to ensure unequivocal cell identification, a low number of electrode penetrations and recordings were performed for each rat (average number of recordings per rat = 3.2 ± 2.7). In the animals with a relatively large number of recordings (> 5), either labeling was not attempted or cell identification could not be assured with certainty because of multiple consecutive electrode penetrations. We note that, given the relatively small number of observations for each rat, a dependency between rat identity and morphological properties cannot be rigorously tested and thus formally ruled out. (B) Representative micrographs of distal dendritic segments for an active and a silent neuron. Scale bars=10 µm. (C) Maximum gray scale values for distal dendritic compartments (top) and the ratio between distal and proximal dendrites (bottom) for active (n=6) and silent neurons (n=7). p-values are indicated (Mann-Whitney U test). See Materials and methods for details. (D) Distribution of terminal dendritic endings as a function of distance from the soma for active (n=6, red) and silent neurons (n=7, blue). Lines represent means, shadows represent SD. The distances of dendritic endings were not significantly different between active and silent neurons (Mann Whitney U Test, p-value is indicated).