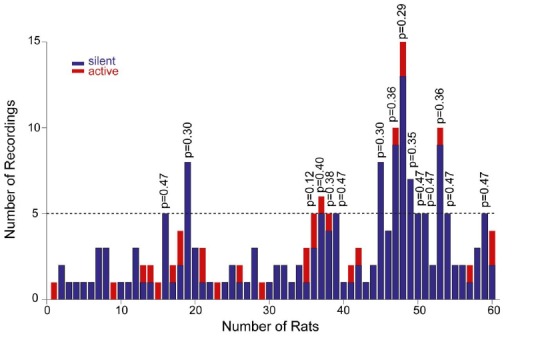
Author response image 1. Distribution of recordings across animals.

Histogram showing the distribution of active (red) and silent recordings (blue) across animals. In the animals with a relatively larger number of recordings (≥5, n=15 rats), the occurrence of active neurons was not significantly different from their expected proportion from the population data (~14%). Corresponding p values from binomial test are shown.
