
Figure 4.
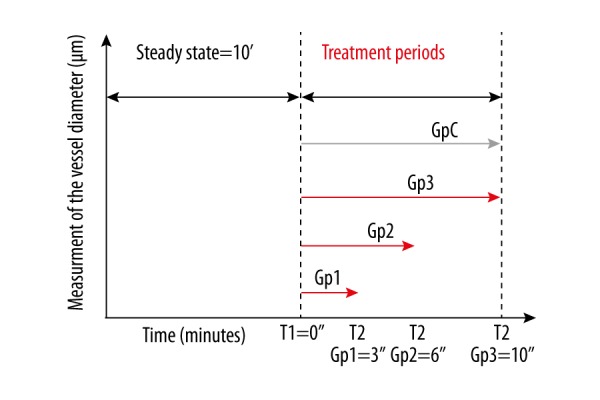
Graphical synthesis of the experimental protocol used for the 4 groups of mice. (Gp=group, Gp C=control group, T1 and T2 are the moments at which the photographs of the vessels were taken.)
Official websites use .gov
A
.gov website belongs to an official
government organization in the United States.
Secure .gov websites use HTTPS
A lock (
) or https:// means you've safely
connected to the .gov website. Share sensitive
information only on official, secure websites.
Graphical synthesis of the experimental protocol used for the 4 groups of mice. (Gp=group, Gp C=control group, T1 and T2 are the moments at which the photographs of the vessels were taken.)