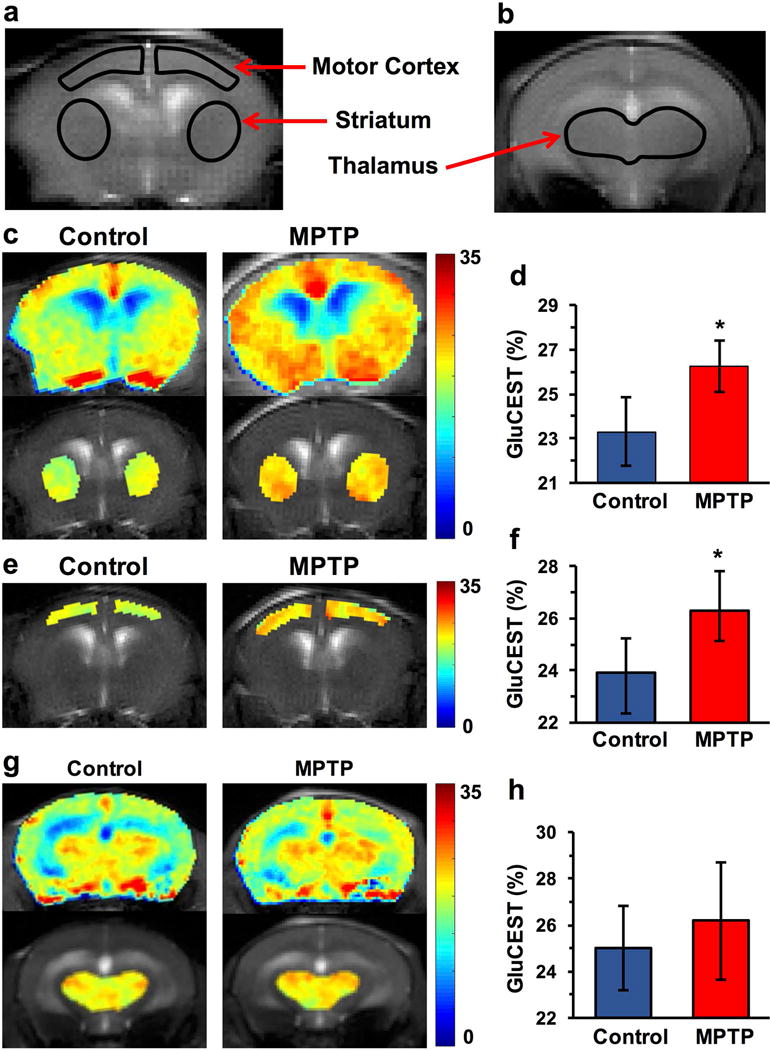
Figure 3.

GluCEST MRI following MPTP treatment. (a,b) T2 weighted images showing ROIs for striatum, motor cortex and thalamus in the coronal brain slices. (c,d) GluCEST contrast in the striatum showing higher GluCEST in MPTP (26.3 ± 1.1 %, n=13) compared to the control mice (23.3 ± 1.5 %, n=11; p≤0.001) (e,f) GluCEST map of motor cortex in the mouse brain showing higher GluCEST contrast in MPTP group (Control: 23.9 ± 1.3 %, n=11; MPTP: 26.3 ± 1.5 %, n=13; p≤0.001) while the (g,h) GluCEST contrast was unaltered in the thalamus following MPTP exposure (Control: 24.8 ± 3.3, MPTP: 25.8 ± 3.4; p=0.34). *, p≤0.001
