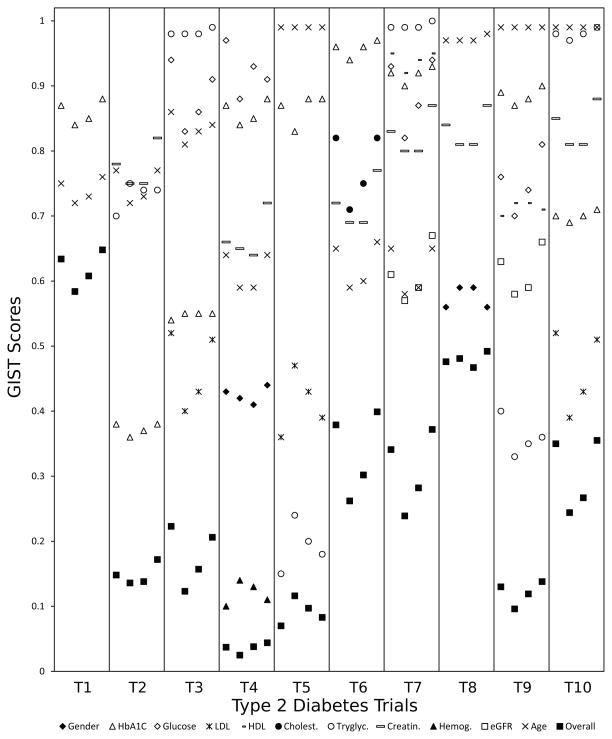
Figure 4.
GIST scores for 10 type 2 diabetes trials. Each swim lane represents a trial and the four sublanes represent the four summarizing statistics (for study traits) from left to right: (a) the mean of all readings (b) the latest reading (c) the mean of up to the last three readings (d) the median of all readings.

