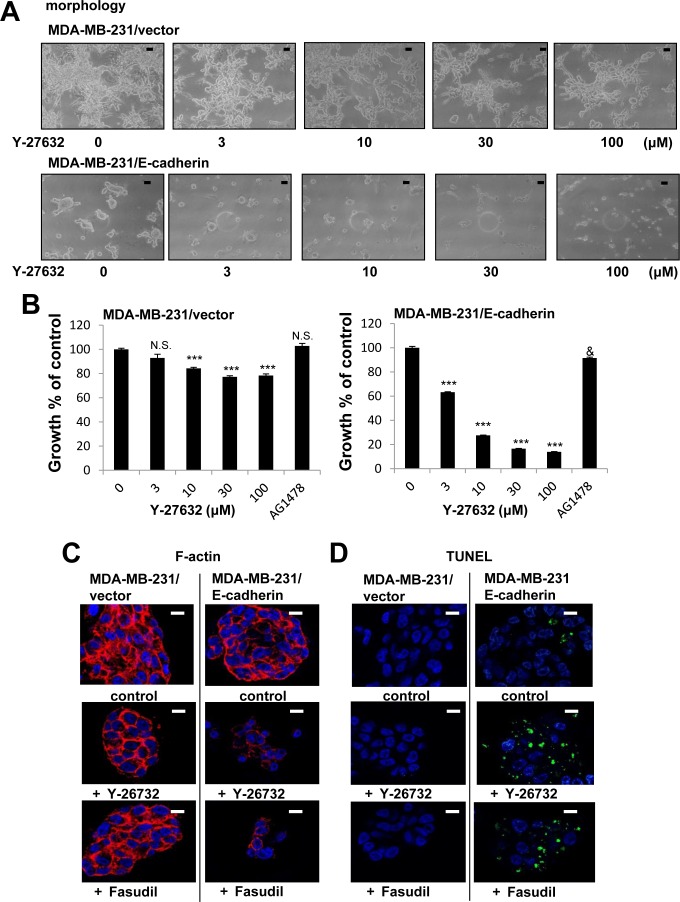
Figure 10. Enhanced growth inhibition by a combination of E-cadherin overexpression and ROCK inhibition in MDA-MB-231 cells in 3D lrECM.
A. Morphological alternations of vector-or E-cadherin-expressing (E-cad-) MDA-MB-231 cells treated with ROCK inhibitor (Y-26732, 3~100 μM). Scale bars: 10 μm. B. Inhibition of proliferation of vector-or E-cad-MDA-MB-231 cells treated with ROCK inhibitor (Y-26732, 3~100 μM) and EGFR inhibitor (AG1478, 0.1 μM). Cell viability was assessed by MTT assay. Values represent means ± SE of four experiments. N.S. (not significant), ***P < 0.001 compared with vehicle control group (Dunnett). N.S. (not significant), &P < 0.05 compared with vehicle control group (Student's t). C. Confocal immunofluorescence of F-actin in vector-or E-cad -MDA-MB-231 cells treated with ROCK inhibitor (Y-26732 or Fasudil, 30 μM). Images were obtained using Alexa Fluor-conjugated phalloidin (F-actin; Red, Nuclei; Blue). Scale bars: 10 μm. D. DNA fragmentation in vector-or E-cad-MDA-MB-231 cells treated with ROCK inhibitor (Y-26732 or Fasudil, 30 μM). TUNEL (TdT-mediated dUTP nick end labeling) staining was performed (Fragmented DNA; Green, Nuclei; Blue). Scale bars: 10 μm.

