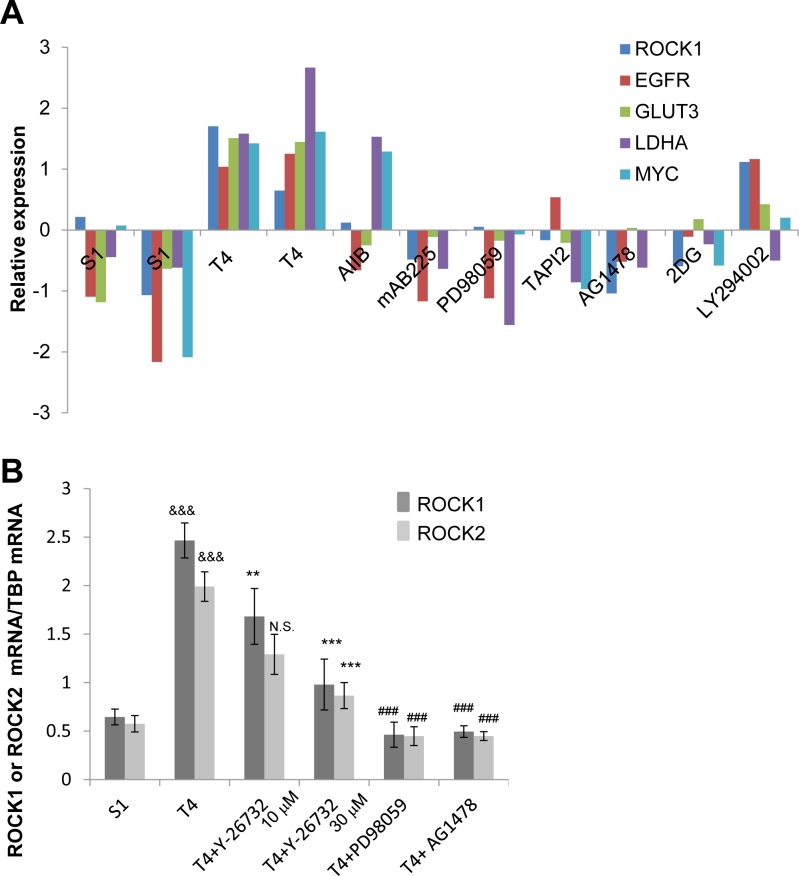
Figure 4. Downregulation of ROCK in reverted T4-2 cells in 3D lrECM.
A. mRNA expression of ROCK1, EGFR, GLUT3, LDHA and c-MYC in S1, and T4-2 and reverted T4-2 cells. Data were retrieved from microarray analysis done by our laboratory and shown as relative expression after preprocessing, normalizing and filtering (arbitrary units). The array data have been stored in GEO (Accession no. GSE50444). AIIB; Integrinβ1 function blocking antibody, mAB225; EGFR function blocking antibody, PD98059; MEK inhibitor, TAPI2; TNF-α converting enzyme (TACE), ADAM (a disintegrin and metalloproteinases) and matrix metalloproteinase (MMP) inhibitor, AG1478; EGFR inhibitor, 2DG (2-deoxyglucose); glucose metabolism inhibitor, LY294002; phosphoinositide 3-kinase inhibitor. B. mRNA expression of ROCK1 and ROCK2 in S1, T4-2, and T4-2 cells treated with ROCK inhibitor (Y-26732, 10, 30 μM), MEK inhibitor (PD98059, 10 μM) and EGFR inhibitor (AG1478, 0.1 μM) were analyzed by real-time quantitative RT-PCR. mRNA expression levels of ROCK1 and ROCK2 were normalized to that of TBP. Values represent means ± SE of six experiments. ROCK1; &&&P < 0.001 compared with S1 group (Student's t). **P < 0.01, ***P < 0.001 compared with vehicle control group (Dunnett). ### P < 0.001 compared with vehicle control group (Student's t). ROCK2; &&&P < 0.001 compared with S1 group (Student's t). N.S. (not significant), ***P < 0.001 compared with vehicle control group (Dunnett). ### P < 0.001 compared with vehicle control group (Student's t).

