
Figure 2. Effect of DCA treatment on brain mitochondrial metabolism.
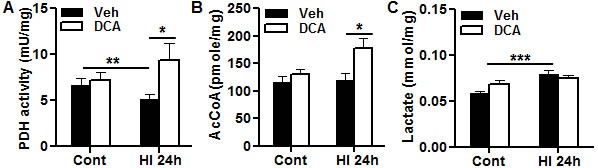
Bar graphs show the effects of DCA treatment on control (Cont) at PND10 and at 24 h post-HI. A. Pyruvate dehydrogenase (PDH) activity assays in the brain cortical mitochondrial fraction. B. Acetyl-coenzyme A (AcCoA) concentrations in the brain cortical mitochondrial fraction. C. Lactate concentration in the brain cortical total homogenate. For all three assays, n = 8 for vehicle group, n = 7 for DCA group.*p < 0.05, **p < 0.01, *** p < 0.001.