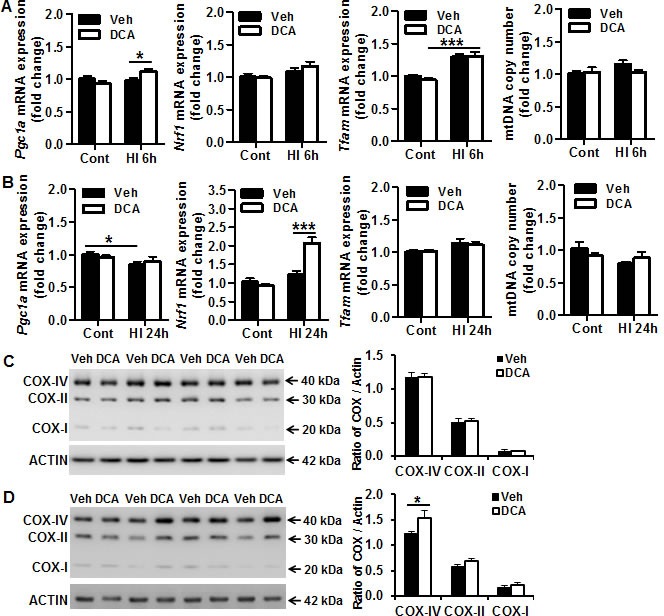
Figure 3. Effect of DCA treatment on brain mitochondrial biogenesis.

A. mRNA expression of mitochondrial biogenesis-related genes (Pgc1α, Nrf1, Tfam) and mtDNA copy number (mtDNA) in DCA-treated and vehicle-treated mice at 6 h after HI. B. mRNA expression of mitochondrial biogenesis-related genes (Pgc1α, Nrf1, Tfam) and mtDNA copy number (mtDNA) in DCA-treated and vehicle-treated mice at 24 h after HI. For all of the above assays, n = 11 for the vehicle control, n = 13 for the DCA control, n = 6 for the 6 h HI and 6 h DCA groups, n = 8 for the 24 h HI vehicle group, and n = 7 for the 24 h HI DCA group. C. Immunoblotting of COX-I, II, and IV in the mitochondrial fraction of normal controls treated with vehicle (Veh) or DCA. D. Immunoblotting of COX-I, II, and IV in the mitochondrial fraction at 24 h after HI showing that and DCA treatment increased COX-I, II, IV expression, and this was more pronounced with COX-IV. *p < 0.05, ***p < 0.001.
