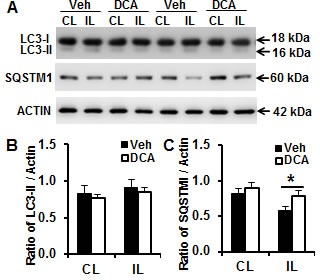
Figure 5. DCA treatment reduced autophagy activity in the mouse brain after HI.

A. Representative immunoblotting pictures show the expression of LC3 and SQSTM1 in the brain mitochondrial fraction at 24 h after HI. B. Quantification of LC3-II immunoblotting normalized to actin in the ipsilateral hemisphere (IL) compared to the contralateral hemisphere (CL) in the vehicle and DCA treatment group. C. Quantification of SQSTM1 immunoblotting in the ipsilateral hemisphere in the vehicle and DCA treatment groups. n = 7 for the vehicle group and n = 6 for the DCA group. *p < 0.05.
