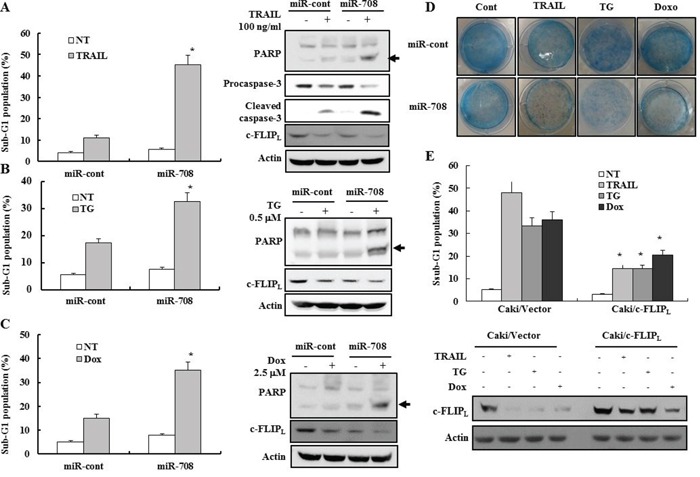
Figure 4. MiR-708-mediated downregulation of c-FLIPL enhances sensitivity to various apoptotic stimuli.

A-C. Caki cells transfected with miR-cont or miR-708 were treated with TRAIL, TG, or Dox for 24 h. The cellular DNA content was then measured after propidium iodide staining. (A) Apoptosis was analyzed as a sub-G1 fraction by FACS. The data is reported as the mean ± SD. (n = 3). * indicates P < 0.05 versus the miR-cont-transfected cells (Left panel). Cells treated as described above were harvested in a lysis buffer and equal amounts of cell lysates (40 μg) were subjected to electrophoresis and analyzed by Western blotting with PARP, procaspase-3, cleaved caspase-3, and actin antibodies. Proteolytic cleavage of PARP is indicated by the arrow (Right panel). (B) Apoptosis was analyzed as a sub-G1 fraction by FACS. The data is reported as the mean ± SD. (n = 3). * indicates P < 0.05 versus the miR-cont-transfected cells (Left panel). Immunoblots for PARP, procaspase-3, cleaved caspase-3, and actin. Proteolytic cleavage of PARP is indicated by the arrow (Right panel). (C) Apoptosis was analyzed as a sub-G1 fraction by FACS. The data is reported as the mean ± SD. (n = 3). * indicates P < 0.05 versus the miR-cont-transfected cells (Left panel). Immunoblots for PARP, procaspase-3, cleaved caspase-3, and actin. Proteolytic cleavage of PARP is indicated by the arrow (Right panel). D. Clonogenic assays performed as described in the Materials and Methods. E. The control pcDNA3.1 or c-FLIPL expression vectors were transiently cotransfected into Caki cells with miR-708 and treated with indicated drugs for 24 h. The cells were harvested and analyzed by FACS (Upper panel) and Western blotting. Western blotting was performed using anti-c-FLIP and actin antibodies to confirm the transfection efficiency (Bottom panel). The data is reported as the mean ± SD (n = 3). * indicates P < 0.05 versus drug-treated vector cells transfected with pcDNA3.1.
