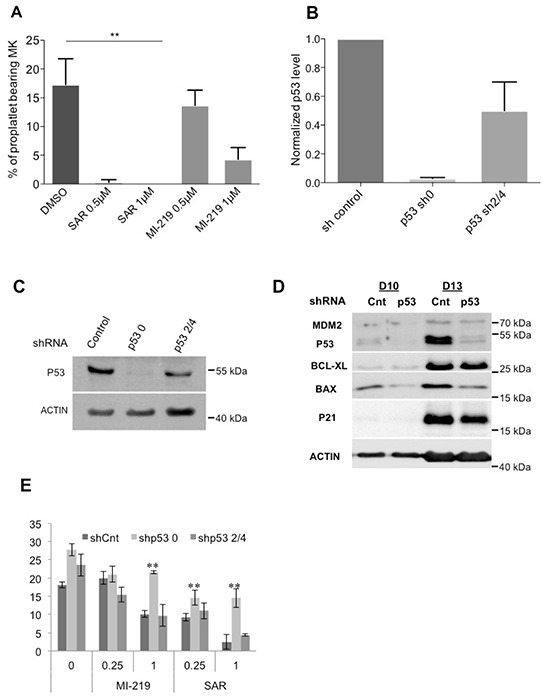
Figure 7. Effects of p53 stabilization on PPT formation.

A. Percentage of proplatelet-forming day 10-MKs after incubation with 0.5 or 1 μM of SAR405838 or MI-219. The percentage of proplatelet-forming MKs was estimated by counting MKs exhibiting one or more cytoplasmic processes with areas of constriction. A total of 200 cells per well were counted during 4 days. Error bars in histograms represent the SD of one representative experiment performed in triplicate wells. Similar results were obtained in 3 repeated experiments. * represents statistical significance (**P<0.01). B. Cells were transduced at day 4 of culture with a control lentivirus (shCnt) or a lentivirus encoding either shRNA p53 (shp53_0) or (shp53_2/4) and p53 gene expression levels were investigated by real-time PCR related to HPRT (n=5). C. p53 protein levels in GFP++CD41+ sorted cells were analyzed at day 9 of culture by western-blot. β-actin was used as loading control. D. p53, MDM2, BCL-XL, BAX and p21 protein levels were analyzed in GFP+/CD41+ sorted cells by Western blot (at days 10 and 13 of culture). β-actin was used as loading control. (n=3) * represents statistical significance (**P<0.01). E. Percentage of shCnt and shp53-transduced proplatelet-forming MKs exposed to 0.25 or 1 μM SAR405838 or MI-219. Day 8-MKs were sorted on the expression of GFP and CD41. Day 10-MKs were seeded with or without SAR405838 at 2×10³ cells/well in 96-well plate. A total of 200 cells per well were counted during 4 days (from day 11 to day 14). The histogram represents the percentage of proplatelet-forming MKs at day 12 of culture. (n=3) * represents statistical significance (**P<0.01).
