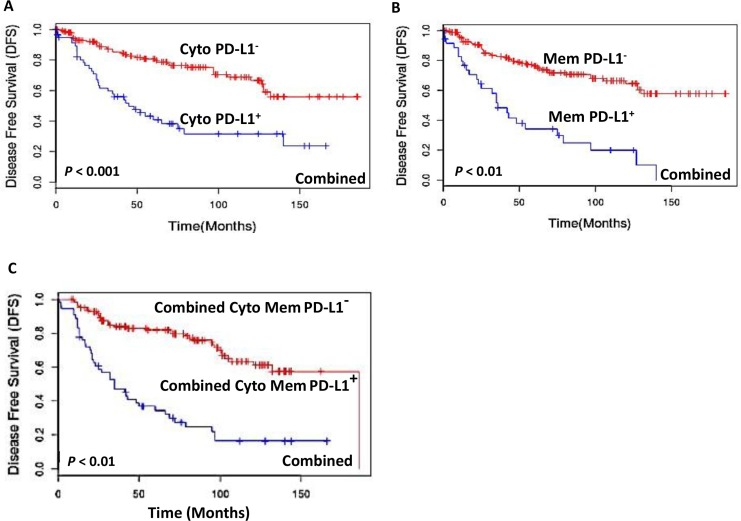
Figure 2. Kaplan-Meier estimation of disease-free survival in PTC patients.
Disease free survival curves showing PD-L1 expression among all the combined stages of PTCs in: (A) cytoplasm [PD-L1 positive median DFS = 49 months (blue lines) and PD-L1 negative DFS = 186 months (red lines); p < 0.001]; (B) plasma membrane [PD-L1 membrane positive tumors median disease free survival (DFS) = 36 months (blue lines) and PD-L1 negative DFS = 186 months (red lines); p < 0.01]; (C) Combined cytoplasmic and membrane PD-L1 positive patients [DFS = 42 months (blue lines) and PD-L1 negative [DFS = 186 months (red lines); p < 0.01].

