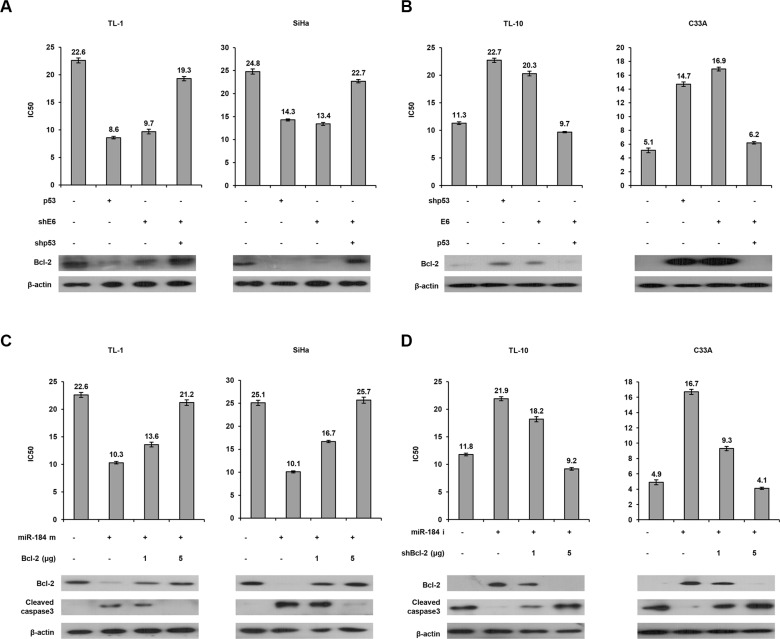
Figure 5. A decrease in miR-184 expression by E6 confers cisplatin resistance via increasing Bcl-2 expression.
(A) TL-1 and SiHa cells were treated with wild-type p53 expression vector (5 μg), shp53 (5 μg), and/or shE6 shRNA (5 μg). (B) TL-10 and C33A were treated with shp53 shRNA (5 μg), wild-type p53 (5 μg), and/or E6 expression vectors (5 μg). After 24 h, the indicated cells were treated with or without cisplatin (0, 2, 4, 8, 16, 32 μM) for 48 h and then the MTT assay was used to determine the IC50 value for cisplatin. (C) TL-1 and SiHa cells were treated with miR-184 mimic (m, 40 nM) and/or Bcl-2 expression vectors. (D) TL-10 and C33A were treated with miR-184 inhibitor (i, 40 nM) and/or shBcl-2. After 24 h, the indicated cells were incubated with or without cisplatin (0, 2, 4, 8, 16, 32 μM) for 48 h and the IC50 value of both cell types transfected with miR-184 inhibitor and/or shBcl-2 was determined by the MTT assay. The cell lysates were separated by SDS-PAGE for the evaluation the expression of Bcl-2 and cleaved caspase3 by western blotting using their specific antibodies.

