
Figure 2. Analysis of metabolic markers in rat preneoplastic nodules and HCC.
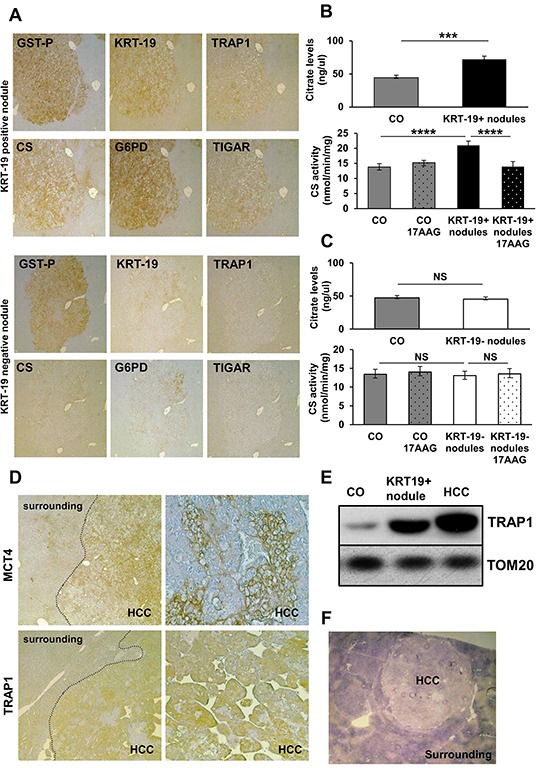
A. IHC analysis on serial sections of liver nodules showing a perfect match between TRAP1, CS, G6PD and TIGAR and positivity for GST-P and KRT-19 (x4). B–C. Analysis of citrate levels (top) and of CS activity (bottom) in control livers (CO) and KRT-19+ or KRT-19− nodules treated or not with 17-AAG. ***P <0.001, ****P <0.0001. D. Staining of MCT4 and TRAP1 in HCCs, but not in the surrounding liver (x4); right side: higher magnification (x20) showing heterogeneous distribution of MCT4 and TRAP1 in HCC. E. Western immunoblot analysis of TRAP1 in KRT-19+ nodules, HCC and control liver (CO). TOM20: loading control. F. Photomicrograph showing impaired SDH activity in HCC (x1.25).