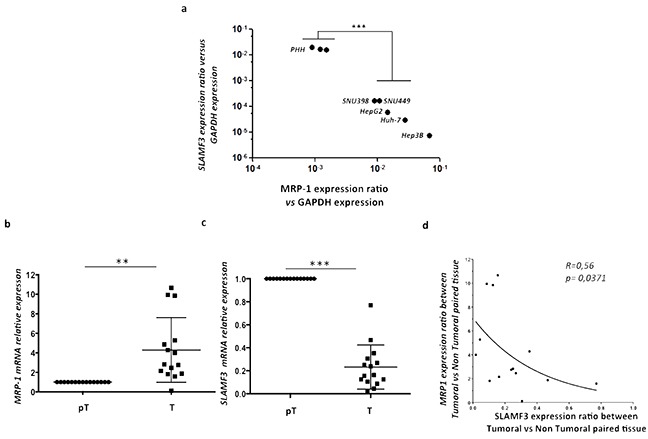
Figure 3. Inverse correlation between SLAMF3 and MRP-1 expression in HCC cell lines and primary hepatocytes.

Total mRNA from primary healthy hepatocytes PHH and different hepatocyte cancerous cell lines (Huh-7, HepG2, Hep3B, SNU398 and SNU449) was extracted and SLAMF3 and MRP-1 mRNA expression was quantified by qRT-PCR a. Transcripts were standardized by GAPDH quantification used as control. Results were presented as the mean of six independent experiments ± SD (n=6, ***p<0.001); b, c. MRP-1 and SLAMF3 mRNA, respectively, expression were analyzed in same extract from resected HCC patients by qRT-PCR. The mRNA quantities were compared between tumor (T) and peri-tumor (pT) areas and results presented as median, *p<0.05 for MRP-1 and ***p<0.005 for SLAMF3. The correlation between SLAMF3 and MRP-1 expressions was evaluated and represented as curve d. R= 0.56 and * p<0.05.
